Fig. 10
Download original image
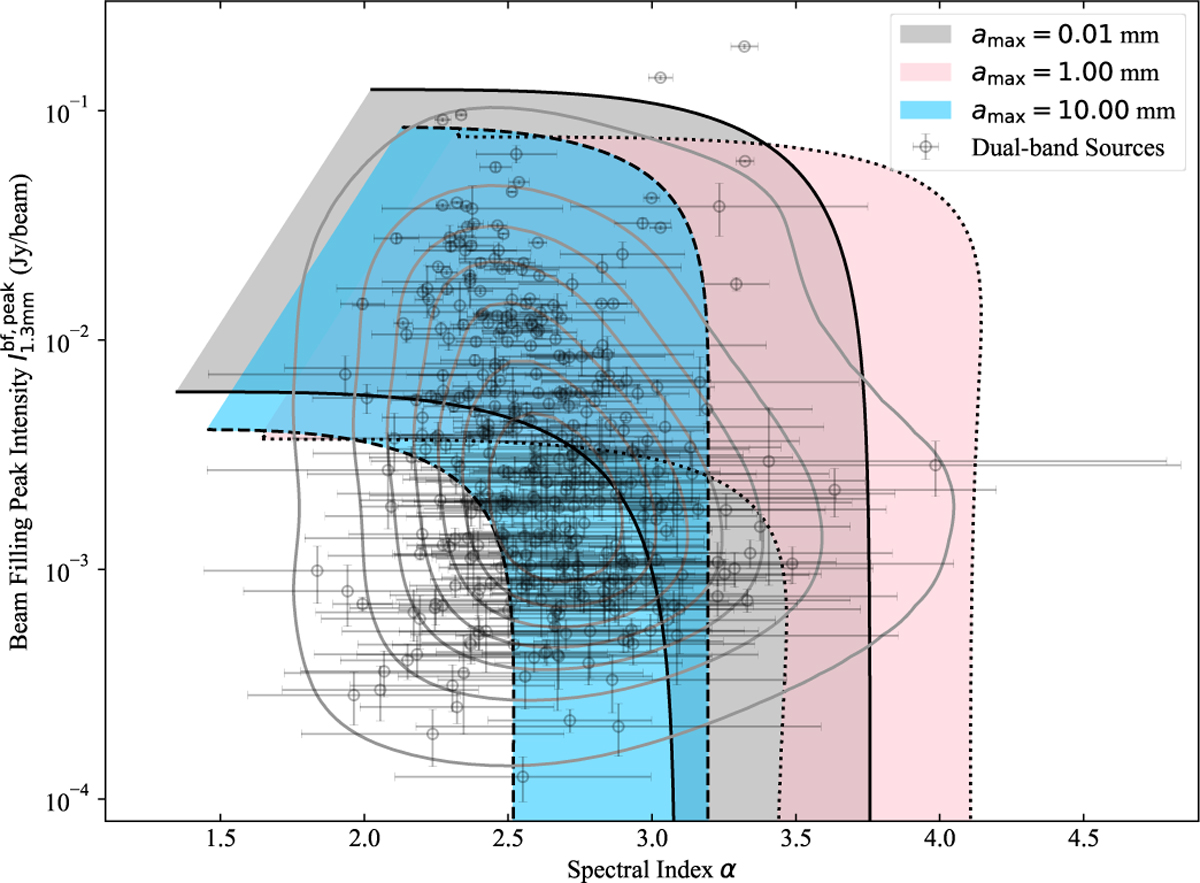
Beam filling peak intensity, ![]() , versus dual-band spectral index, α. The black circles with error bars show the dual-band detections, of which the KDE is shown in gray contours. The self-consistent dust models (Liu 2019) are shown with shaded regions that cover the temperature range of 6–48 K. The gray, pink, and blue colors represent cases for amax = 0.01, 1, and 10 mm, respectively. The tracks start with the optically thin case from the bottom where
, versus dual-band spectral index, α. The black circles with error bars show the dual-band detections, of which the KDE is shown in gray contours. The self-consistent dust models (Liu 2019) are shown with shaded regions that cover the temperature range of 6–48 K. The gray, pink, and blue colors represent cases for amax = 0.01, 1, and 10 mm, respectively. The tracks start with the optically thin case from the bottom where ![]() , peak increases linearly with surface density and α keeps invariant. As it becomes optically thick,
, peak increases linearly with surface density and α keeps invariant. As it becomes optically thick, ![]() becomes more saturated, and α decreases down to ≃ 2 as in the case of blackbody.
becomes more saturated, and α decreases down to ≃ 2 as in the case of blackbody.
Current usage metrics show cumulative count of Article Views (full-text article views including HTML views, PDF and ePub downloads, according to the available data) and Abstracts Views on Vision4Press platform.
Data correspond to usage on the plateform after 2015. The current usage metrics is available 48-96 hours after online publication and is updated daily on week days.
Initial download of the metrics may take a while.