Fig. 1
Download original image
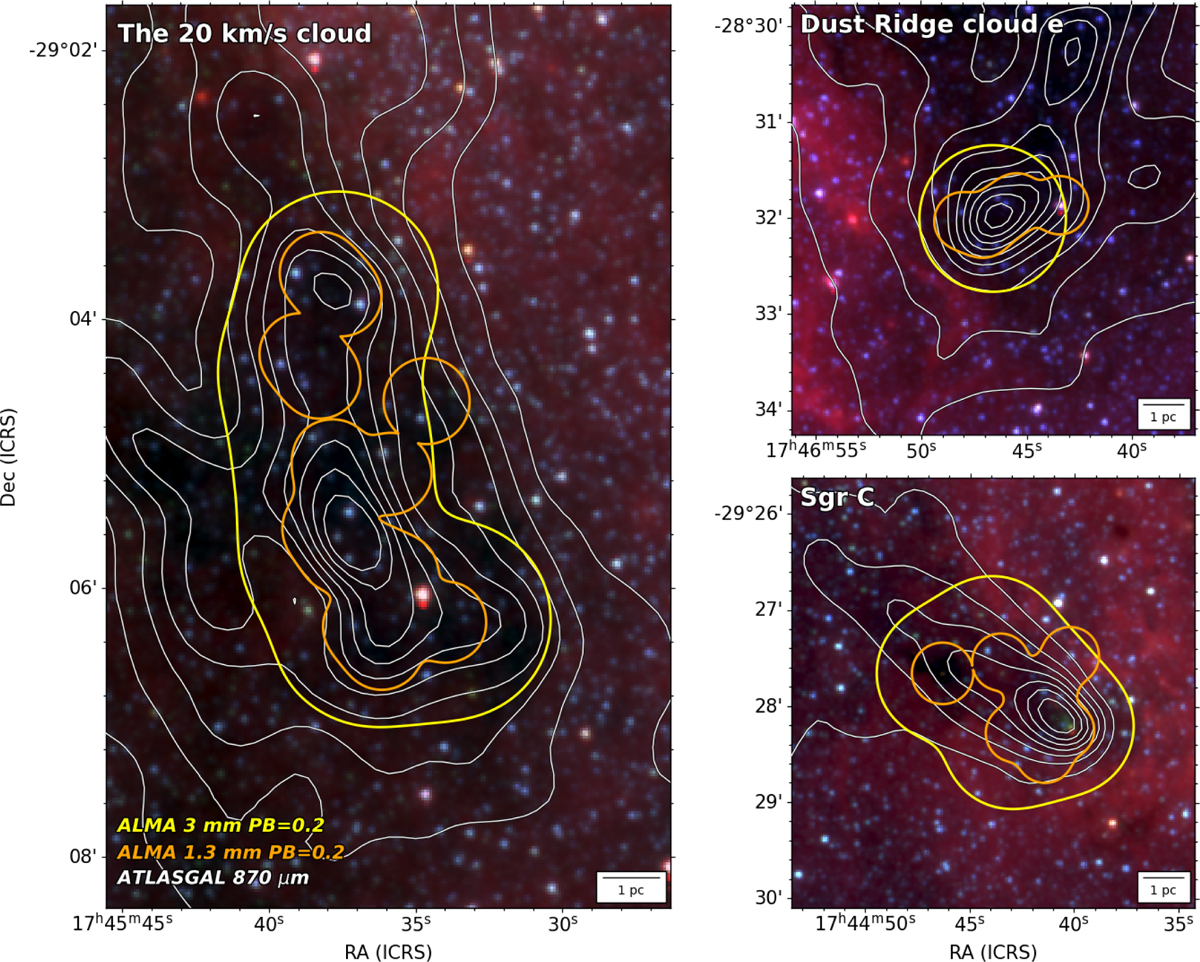
Overview of the three CMZ clouds, the 20 km s−1, Sgr C, and the dust ridge cloud e by the dual-band ALMA observations. The background pseudo-color maps show the composite Spitzer 3.6, 4.5 and 8.0 μm emission. The white contours show the ATLASGAL 870 μm emission, with contour levels increasing from 3 by a step of 1 Jy beam−1, up to 12 Jy beam−1. The dashed yellow and orange loops outline the primary beam response of 0.2 for ALMA 3 and 1.3 mm observations, respectively. The scale bar of 1 pc is shown on the bottom right.
Current usage metrics show cumulative count of Article Views (full-text article views including HTML views, PDF and ePub downloads, according to the available data) and Abstracts Views on Vision4Press platform.
Data correspond to usage on the plateform after 2015. The current usage metrics is available 48-96 hours after online publication and is updated daily on week days.
Initial download of the metrics may take a while.