Fig. 5
Download original image
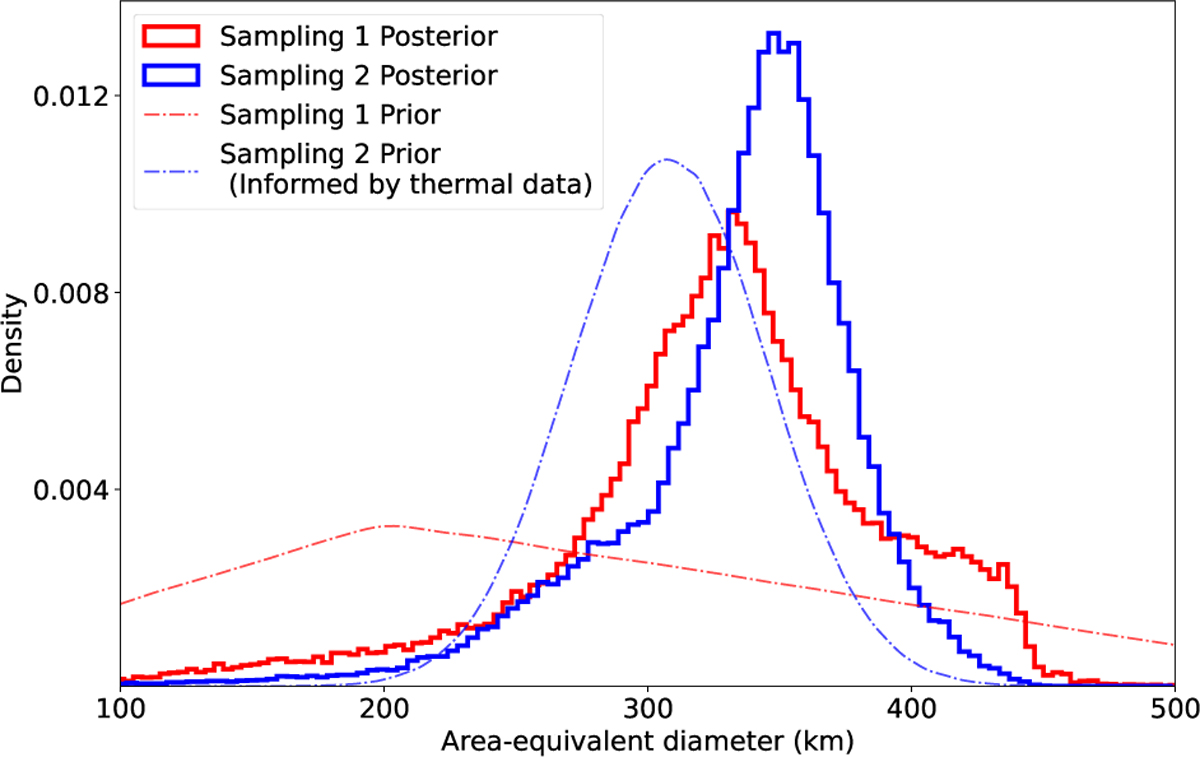
Histogram comparison of the posterior samples in Deq. The priors are plotted for reference (dashed lines). Sampling 1 is our preferred sampling, with uniform priors in all our model parameters. However, as Deq is not directly a model parameter, the prior in this value is not uniform. In sampling 2, the prior in Deq is equivalent to the value reported in Santos-Sanz et al. (2012) from thermal data. This prior pdf peaks at a higher Deq value than the prior pdf of sampling 1. Consequently, the posterior pdf in sampling 2 also peaks at a higher value than in sampling 1. However, both distributions yield compatible results within 1σ (68% credible intervals). Moreover, the result from sampling 1 is also compatible with the result from thermal data (sampling 2 prior).
Current usage metrics show cumulative count of Article Views (full-text article views including HTML views, PDF and ePub downloads, according to the available data) and Abstracts Views on Vision4Press platform.
Data correspond to usage on the plateform after 2015. The current usage metrics is available 48-96 hours after online publication and is updated daily on week days.
Initial download of the metrics may take a while.