Fig. 4
Download original image
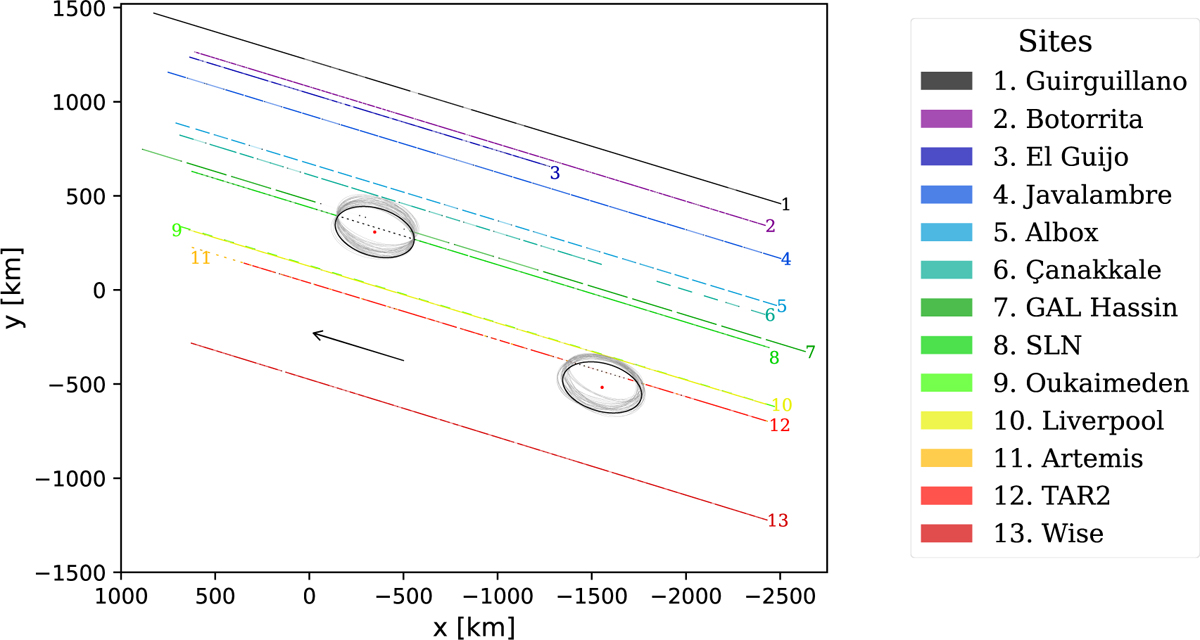
Occultation data plotted on the sky plane with the results of sampling 1. The X − and Y-axes are pointing towards east and north, respectively. The arrow indicates the relative direction of motion of the occulted stars. Each line segment represents an exposure. The transparency of each segment corresponds to the normalised flux measured in that integration (see Fig. 2). No transparency means flux = 1. In the light curve from Çanakkale there is an abnormally long dead-time between two concrete exposures. The corresponding blank space should not be mistaken for a flux drop. The pair of black ellipses represent the nominal solution reported in Table 3 for sampling 1. Their centres are marked with red dots. The thinner grey ellipses represent the 1σ uncertainties from the extracted sample, as discussed in the text.
Current usage metrics show cumulative count of Article Views (full-text article views including HTML views, PDF and ePub downloads, according to the available data) and Abstracts Views on Vision4Press platform.
Data correspond to usage on the plateform after 2015. The current usage metrics is available 48-96 hours after online publication and is updated daily on week days.
Initial download of the metrics may take a while.