Fig. 3

Download original image
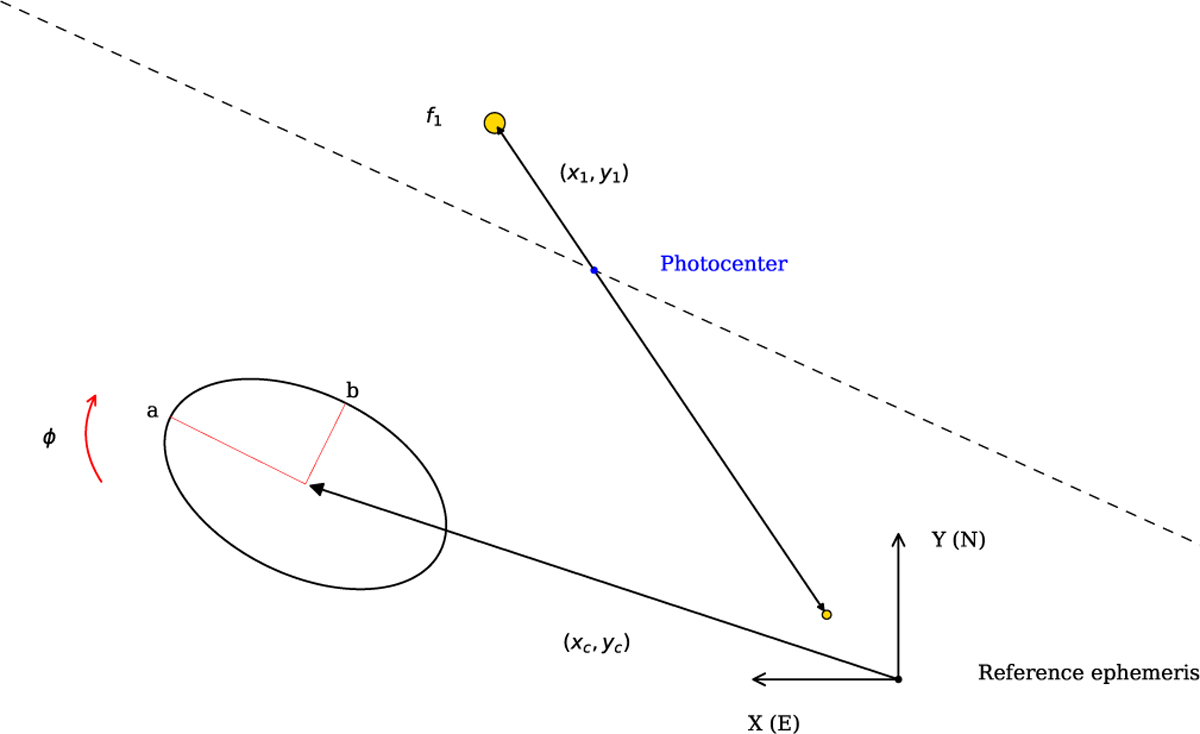
Schematic representation of the model. The dashed line represents the path followed by the target star photocentre (αast, δast in Table 1) on the sky plane, as seen from a certain site. The stars are represented by the yellow dots; the size of the dot is proportional to the brightness. The origin on the sky plane (black dot) is determined by the theoretical astrometric position of 2007 OC10 according to our reference ephemeris. In this particular configuration of parameters, the site for which the chord is represented would observe the occultation, with a residual flux in the drop of f1 (secondary star occulted, primary star visible).
Current usage metrics show cumulative count of Article Views (full-text article views including HTML views, PDF and ePub downloads, according to the available data) and Abstracts Views on Vision4Press platform.
Data correspond to usage on the plateform after 2015. The current usage metrics is available 48-96 hours after online publication and is updated daily on week days.
Initial download of the metrics may take a while.


