Fig. 2
Download original image
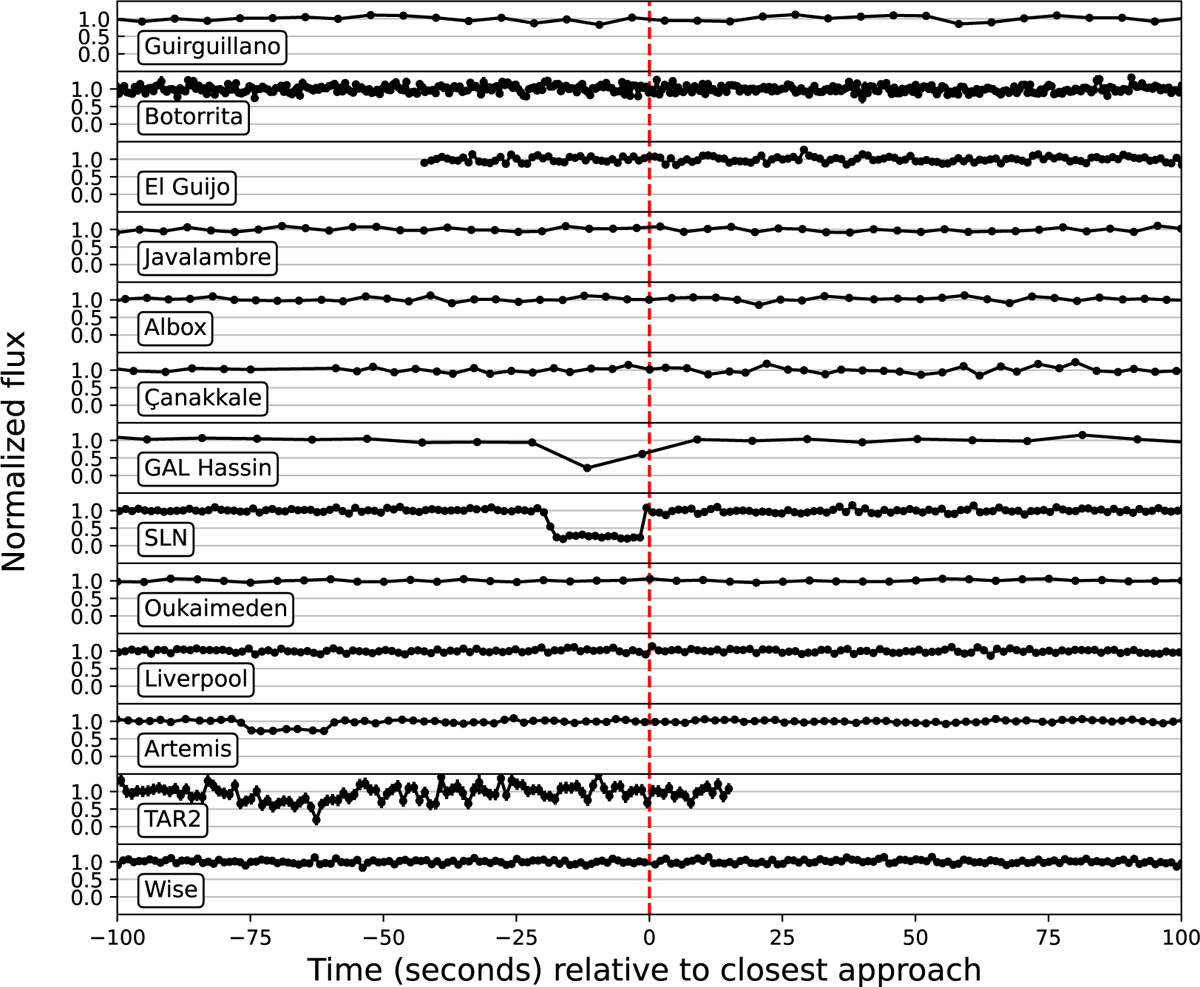
Light curves of the stellar occultation (normalised flux vs time at mid-exposure). The origin of time is set to be the time of closest approach: 2022-08-22T01:32:37 UTC. They are ordered by distance perpendicular to the predicted shadow path (as predicted by CAHA data). The error bars are too small to be seen in the plot in most light curves, but they can be checked in the supplementary data on CDS.
Current usage metrics show cumulative count of Article Views (full-text article views including HTML views, PDF and ePub downloads, according to the available data) and Abstracts Views on Vision4Press platform.
Data correspond to usage on the plateform after 2015. The current usage metrics is available 48-96 hours after online publication and is updated daily on week days.
Initial download of the metrics may take a while.