Fig. D.1
Download original image
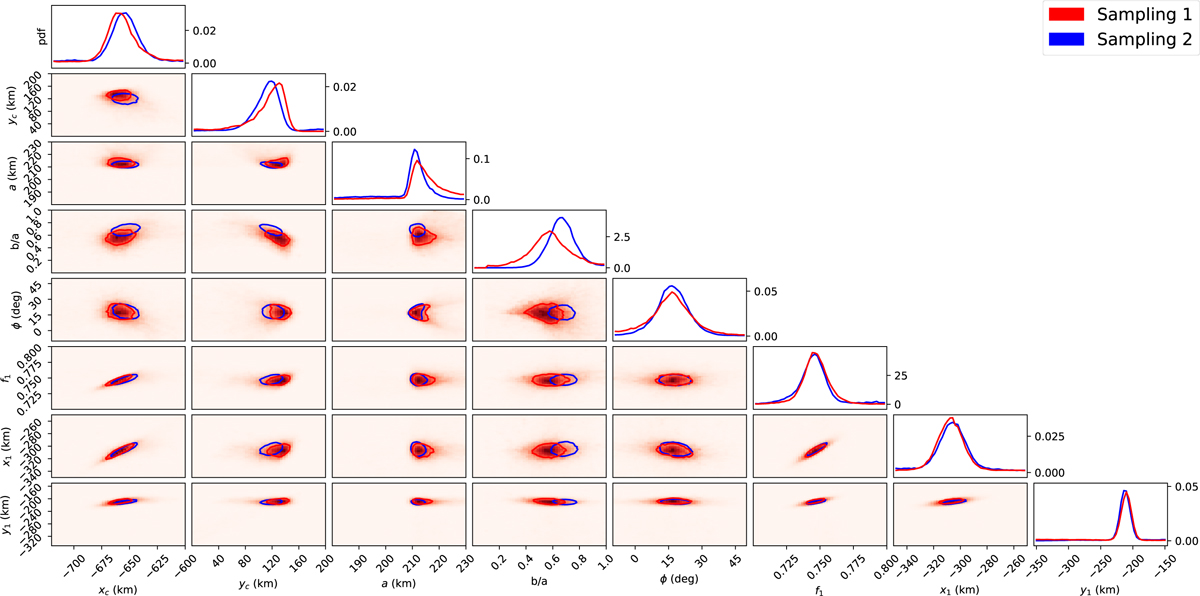
Pairwise marginal plot for our two MCMC samples of the posterior density. There are no signs of other modes representing alternative solutions. In the bidimensional plots, the represented region encircles 39.4% of the samples (representing the 1σ region). The red shading in these regions is a bidimensional histogram for our preferred sampling 1.
Current usage metrics show cumulative count of Article Views (full-text article views including HTML views, PDF and ePub downloads, according to the available data) and Abstracts Views on Vision4Press platform.
Data correspond to usage on the plateform after 2015. The current usage metrics is available 48-96 hours after online publication and is updated daily on week days.
Initial download of the metrics may take a while.