Fig. 8
Download original image
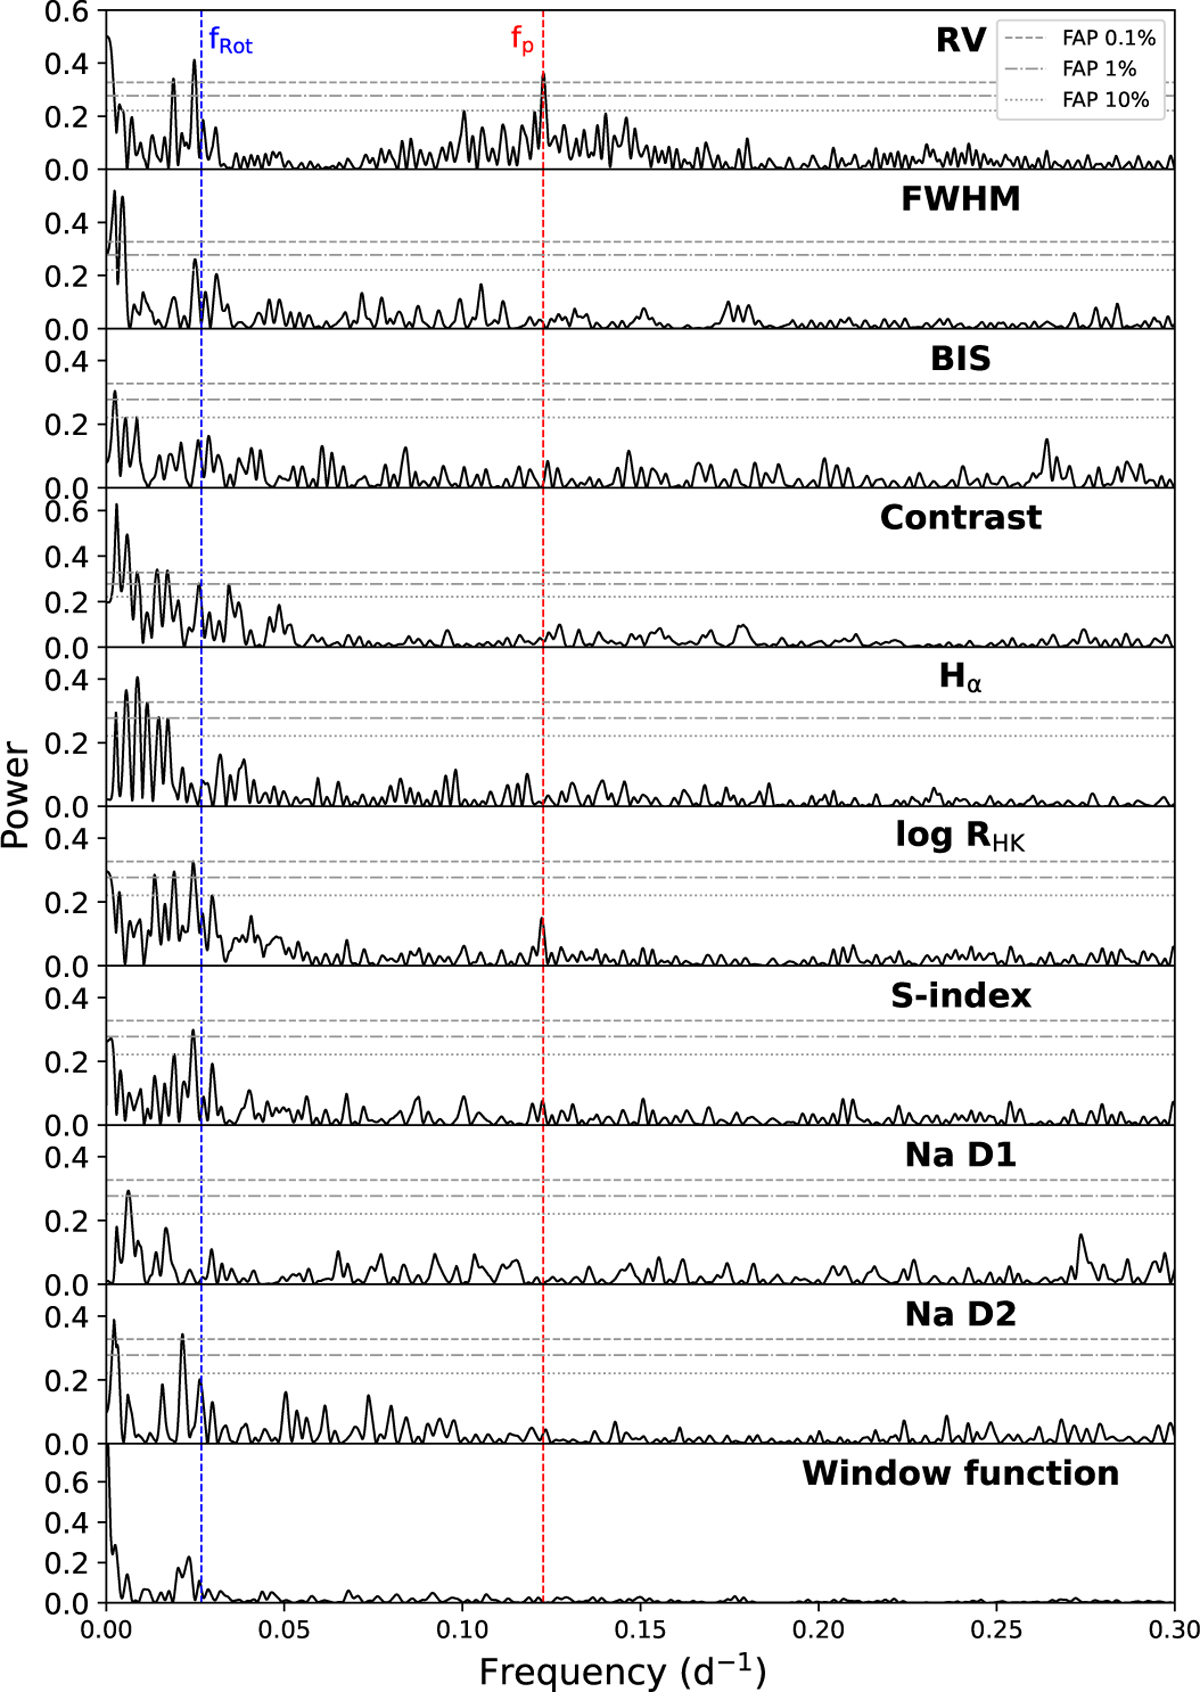
GLS periodograms of various parameters derived from the HARPS data: RV measurements, FWHM of the CCF, BIS, contrast, Hα index, log![]() index, S-index, Na ID1, and Na ID2, juxtaposed with the respective window function to scrutinize potential alias signals. A vertical red line is annotated to denote the frequency corresponding to the period of the planet (8.15 d). and the blue line corresponds to the rotational period of the star (37.4 d).
index, S-index, Na ID1, and Na ID2, juxtaposed with the respective window function to scrutinize potential alias signals. A vertical red line is annotated to denote the frequency corresponding to the period of the planet (8.15 d). and the blue line corresponds to the rotational period of the star (37.4 d).
Current usage metrics show cumulative count of Article Views (full-text article views including HTML views, PDF and ePub downloads, according to the available data) and Abstracts Views on Vision4Press platform.
Data correspond to usage on the plateform after 2015. The current usage metrics is available 48-96 hours after online publication and is updated daily on week days.
Initial download of the metrics may take a while.