Fig. 7
Download original image
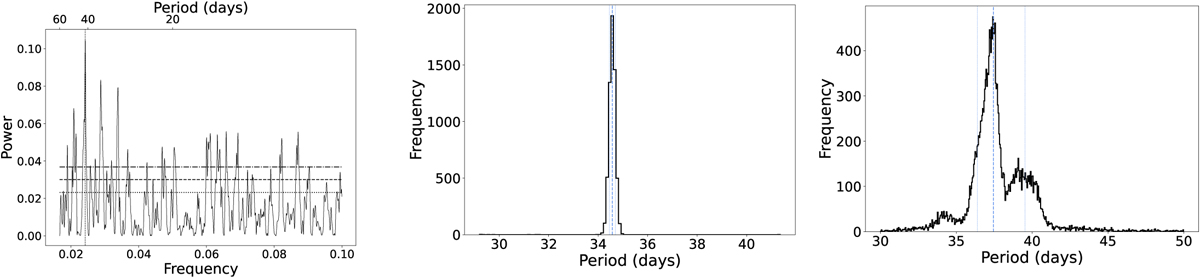
Rotational period of TOI-3493 determined through photometry and spectroscopy data described in the following panels. (Left) GLS periodogram for the SuperWasp data plotted, with a significant peak occurring at 41 d and several secondary peaks occurring between 30–50 d. The false alarm probabilities at 0.1%, 1%, and 10% are plotted from top to bottom. (Middle) PDF for the most significant period at 34.5 d by modeling the nightly binned photometric SuperWASP data with GPs. (Right) PDF for the estimated rotational period of the star, while modeling the RV data with GPs. The PDF has a peak at 37.4 ± 1.5 d followed by a small peak centered at 39 d.
Current usage metrics show cumulative count of Article Views (full-text article views including HTML views, PDF and ePub downloads, according to the available data) and Abstracts Views on Vision4Press platform.
Data correspond to usage on the plateform after 2015. The current usage metrics is available 48-96 hours after online publication and is updated daily on week days.
Initial download of the metrics may take a while.