Fig. 3
Download original image
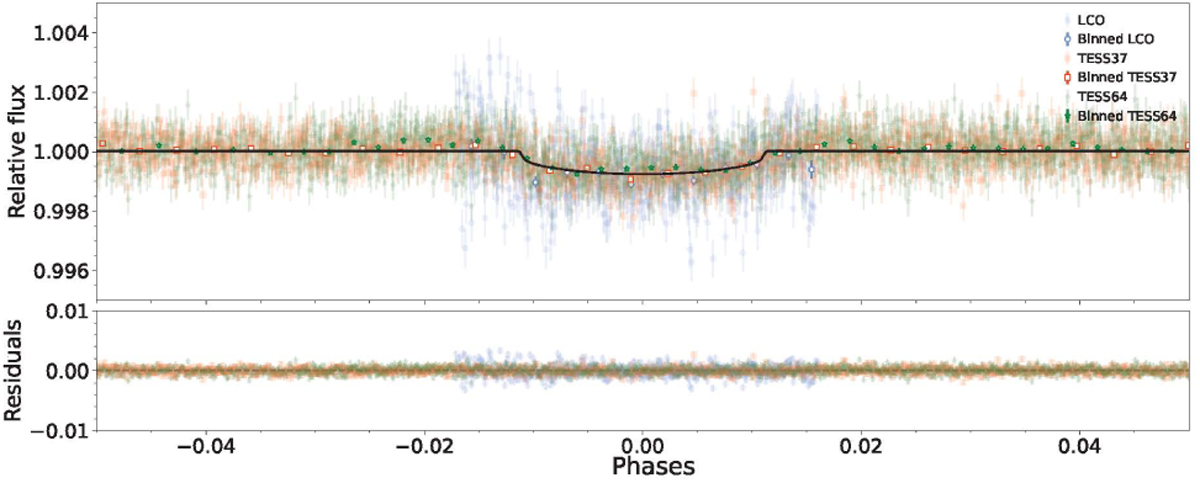
Phase-folded TESS and LCOGT transit light curves for TOI-3493 b at 8.15 d. Gray circles are LCO observed points, red squares and green stars are 2 minute cadence TESS data for sectors 37 and 64, respectively, and darker shades of the same color are binned data for respective datasets (shown only for reference; unbinned points were used to fit the model). The best-fit,juliet model (black line; see Sect. 4) is overplotted for TOI-3493 b.
Current usage metrics show cumulative count of Article Views (full-text article views including HTML views, PDF and ePub downloads, according to the available data) and Abstracts Views on Vision4Press platform.
Data correspond to usage on the plateform after 2015. The current usage metrics is available 48-96 hours after online publication and is updated daily on week days.
Initial download of the metrics may take a while.