Fig. A.3.
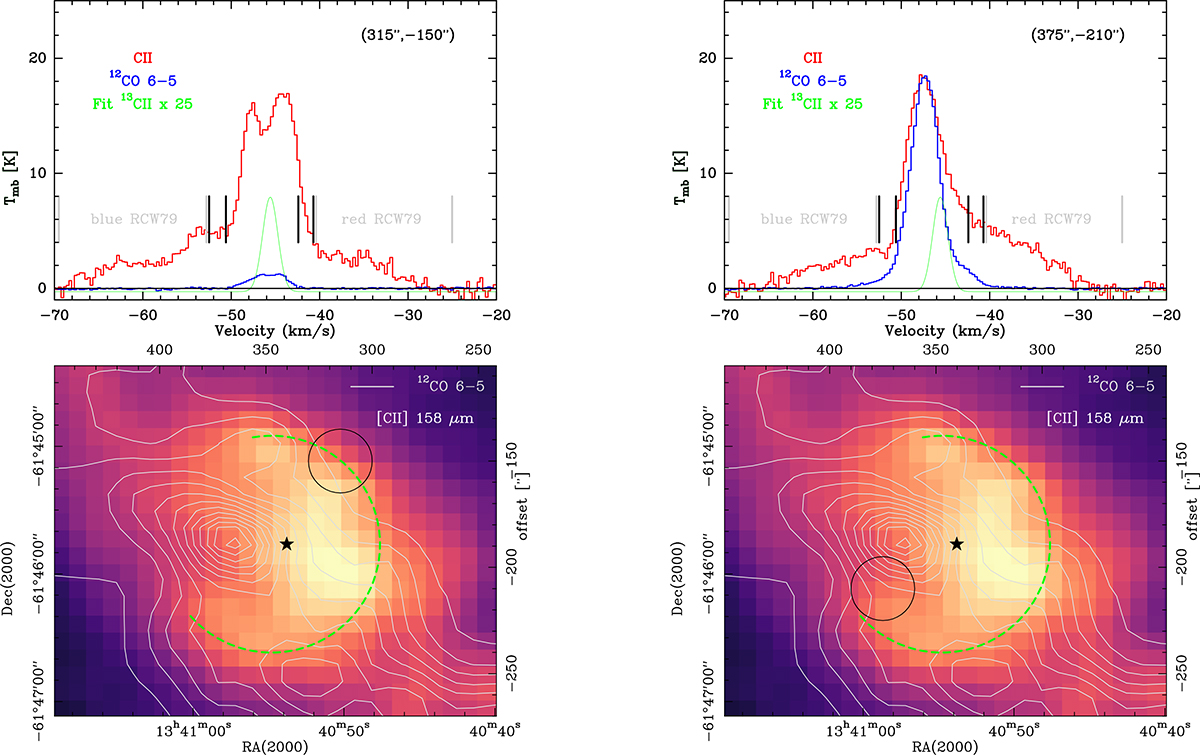
Download original image
Example spectra of [12C II] and 12CO 6 → 5 lines with a fit to the HFS F = 1 − 0 component of the average [13C II] line. The upper panels show the spectra/fit in a smoothed 30″ beam at the positions marked by a black circle in the lower panel of line-integrated [C II] emission and 12CO 6 → 5 emission contours (10 to 130 by 10 K km s−1). The two pairs of gray lines mark the blue and red velocity ranges of the large expanding [C II] shell over the whole RCW79 region (Bonne et al. 2023). The two pairs of black lines outline approximately the velocity range of the expanding [C II] shell. The black star in the lower panels indicates the position of the O-star and the green dashed circle the 8 μm ring. A movie showing all spectra is available online.
Current usage metrics show cumulative count of Article Views (full-text article views including HTML views, PDF and ePub downloads, according to the available data) and Abstracts Views on Vision4Press platform.
Data correspond to usage on the plateform after 2015. The current usage metrics is available 48-96 hours after online publication and is updated daily on week days.
Initial download of the metrics may take a while.