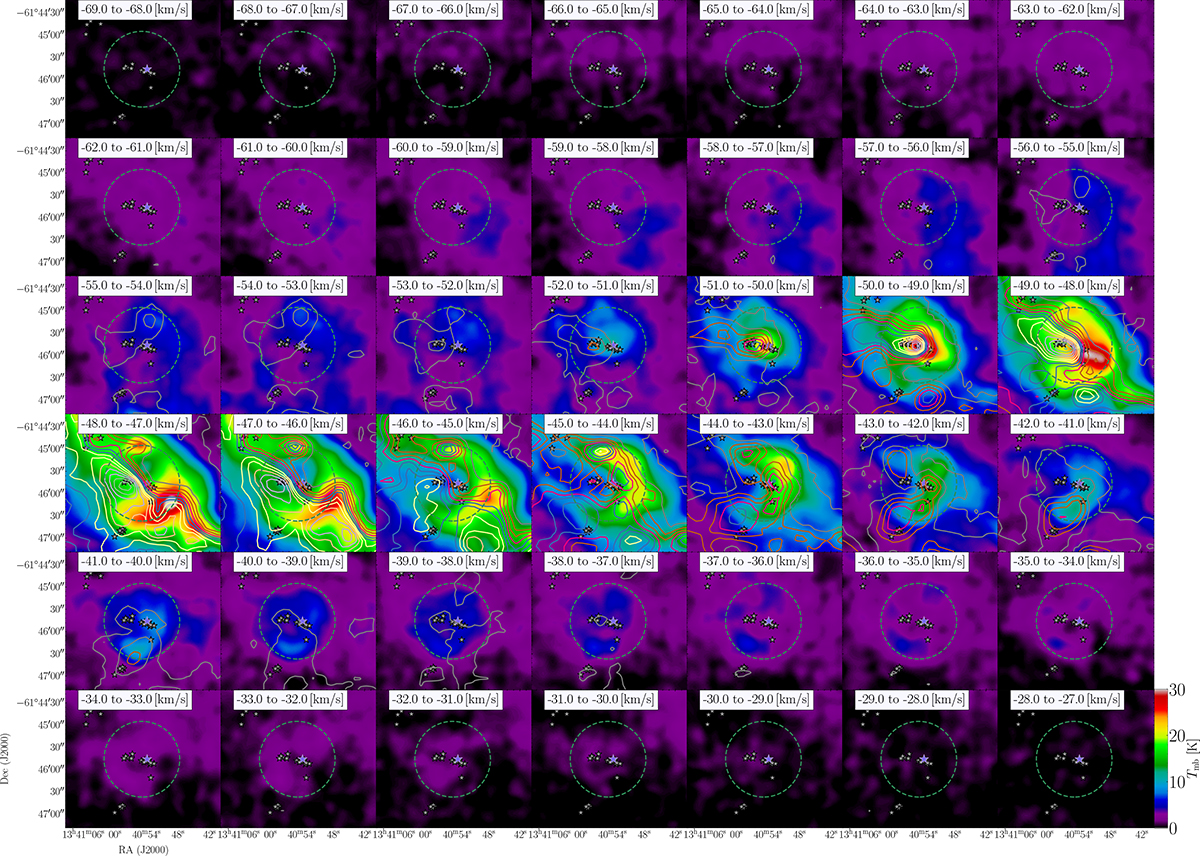
Fig. A.2.
Download original image
Channel map showing [C II] and 12CO 3 → 2 emissions of the C+ bubble. CO contours range from 0.67 to 32 K km s−1 in steps of 2.4 K km s−1. The prominent blue star marks the position of the exciting O star, while smaller black stars denote IR cluster members. The green dotted circle indicates the approximate extent of the IR shell as observed in the Spitzer 8 μm image.
Current usage metrics show cumulative count of Article Views (full-text article views including HTML views, PDF and ePub downloads, according to the available data) and Abstracts Views on Vision4Press platform.
Data correspond to usage on the plateform after 2015. The current usage metrics is available 48-96 hours after online publication and is updated daily on week days.
Initial download of the metrics may take a while.