Fig. A.1.
Download original image
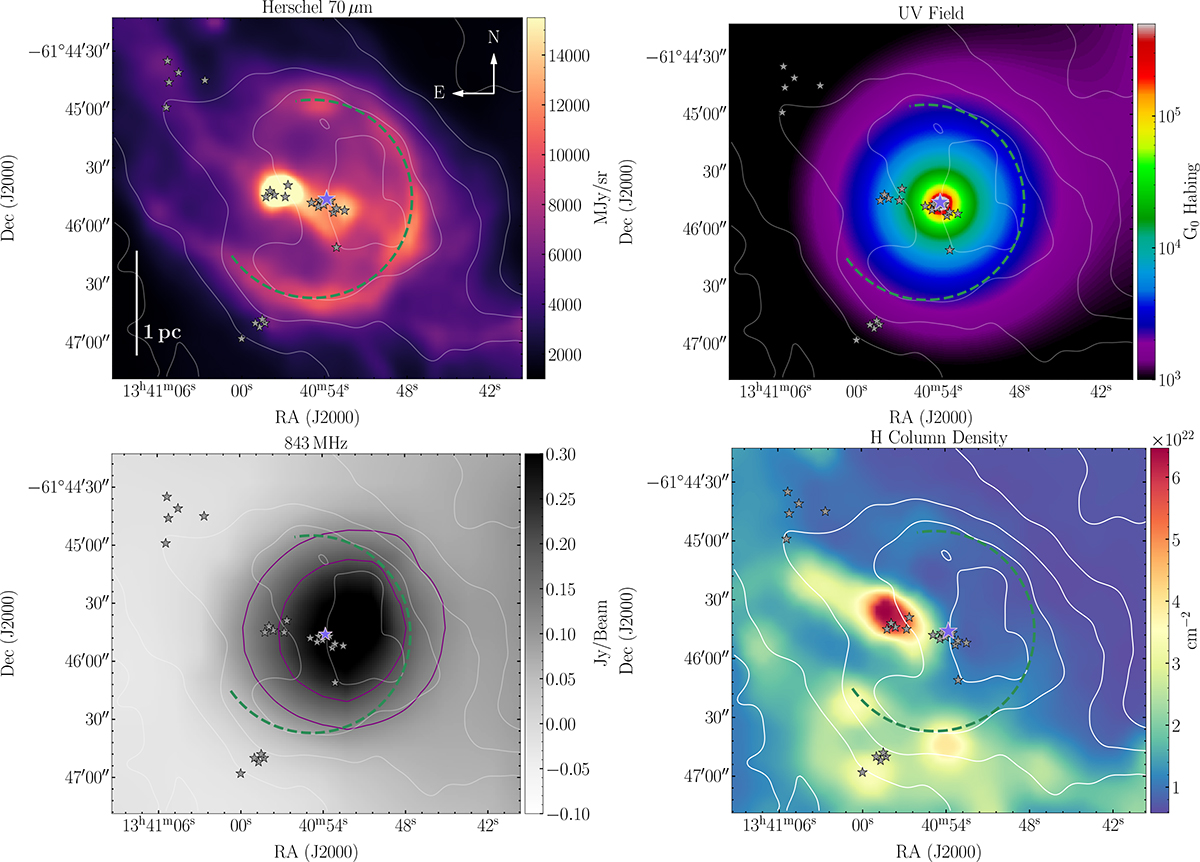
Complementary plots for the S144 C+ bubble in RCW79. The upper left panel illustrates the 70 μm emission from Herschel at ∼6″ resolution. This emission resembles the Spitzer 8 μm image (as seen in Fig. 1), though it highlights more clearly the NE clump containing the embedded IR cluster in the 70 μm map. The upper right panel presents the UV field, which is derived from the spectral type of the O star (indicated by a blue star) and the central O-cluster from RCW79, located farther to the west. The lower left panel displays the 843 MHz emission with a 45″ angular resolution, outlining the H II region (Cohen et al. 2002). In the lower right panel, the Herschel dust column density map (Liu et al. 2017) at 18″ angular resolution reveals the clumpy structure of condensation 2. Each panel includes [C II] contours in increments of 50 K km s−1 from 50 to 250 K km s−1, while the 843 MHz map also depicts 843 MHz contours at 0.1 and 0.2 Jy/Beam in purple. The small black stars are members of the IR clusters.
Current usage metrics show cumulative count of Article Views (full-text article views including HTML views, PDF and ePub downloads, according to the available data) and Abstracts Views on Vision4Press platform.
Data correspond to usage on the plateform after 2015. The current usage metrics is available 48-96 hours after online publication and is updated daily on week days.
Initial download of the metrics may take a while.