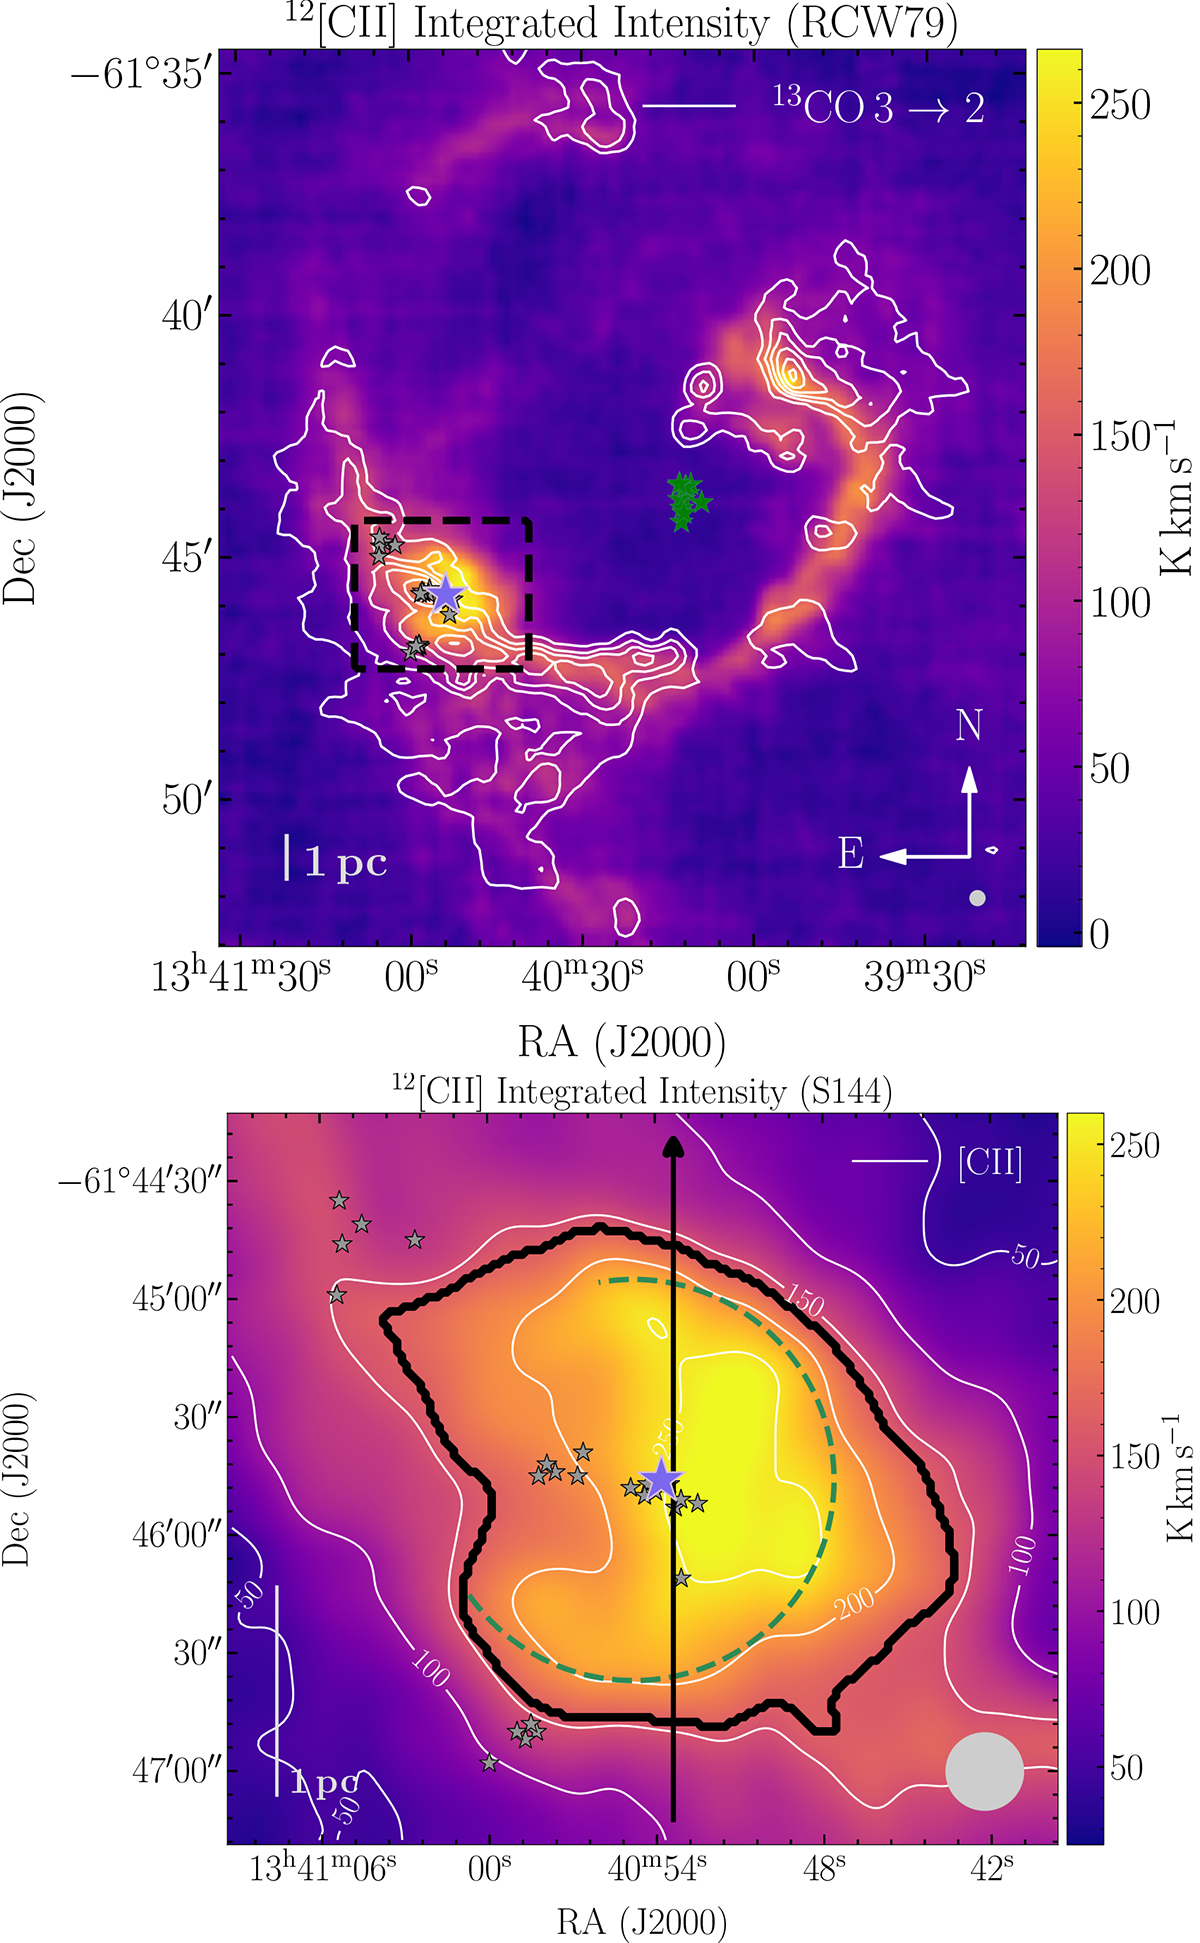
Fig. 2.
Download original image
Line-integrated (−70 to −20 km s−1) [C II] intensity maps of RCW79 and S144. Top: RCW79 with an overlay of 13CO 3 → 2 emission with contours from 7 to 52 K km s−1 in steps of 9 K km s−1 (∼5σ). The green stellar symbols indicate the central cluster of O-type stars (Martins et al. 2010), the blue stellar symbol the exciting O7.5–9.5V/III star of the cH IIR within S144 in the southeast, and the small black stellar symbols members of the IR clusters (Zavagno et al. 2006). The dashed black rectangle outlines the area shown in the bottom panel. Bottom: S144 with an overlay of 13CO 3 → 2 at the same levels as in the upper panel. The dashed green circle (50″ radius) indicates the bright IR ring seen in the Spitzer 8 μm map (see Fig. 1). The region taken into account to compute the average [C II] spectrum is indicated by a black contour. The black line corresponds to the PV cut shown in Fig. 3. Both maps have an angular resolution of 20″, indicated by gray disks in the lower right corner of the panels.
Current usage metrics show cumulative count of Article Views (full-text article views including HTML views, PDF and ePub downloads, according to the available data) and Abstracts Views on Vision4Press platform.
Data correspond to usage on the plateform after 2015. The current usage metrics is available 48-96 hours after online publication and is updated daily on week days.
Initial download of the metrics may take a while.