Fig. C.5.
Download original image
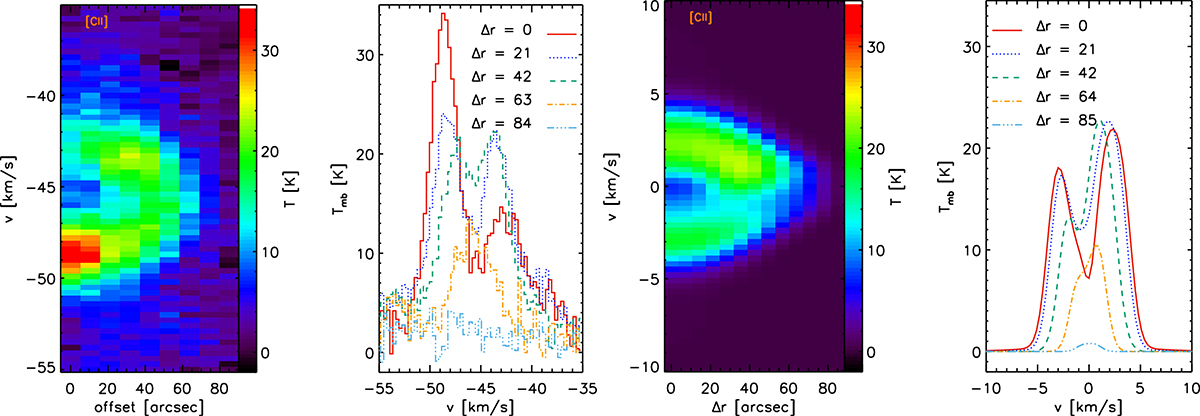
Observations versus results of the SimLine modeling. The left panel shows a PV cut from the center position along the positions of the observed and modeled spectra, indicated in Fig. C.1, together with the observed spectra. Δr = 21, etc. corresponds to an offset of (−15″, 15″) etc. The right panel displays the modeled PV cut and spectra from SimLine.
Current usage metrics show cumulative count of Article Views (full-text article views including HTML views, PDF and ePub downloads, according to the available data) and Abstracts Views on Vision4Press platform.
Data correspond to usage on the plateform after 2015. The current usage metrics is available 48-96 hours after online publication and is updated daily on week days.
Initial download of the metrics may take a while.