Fig. C.4.
Download original image
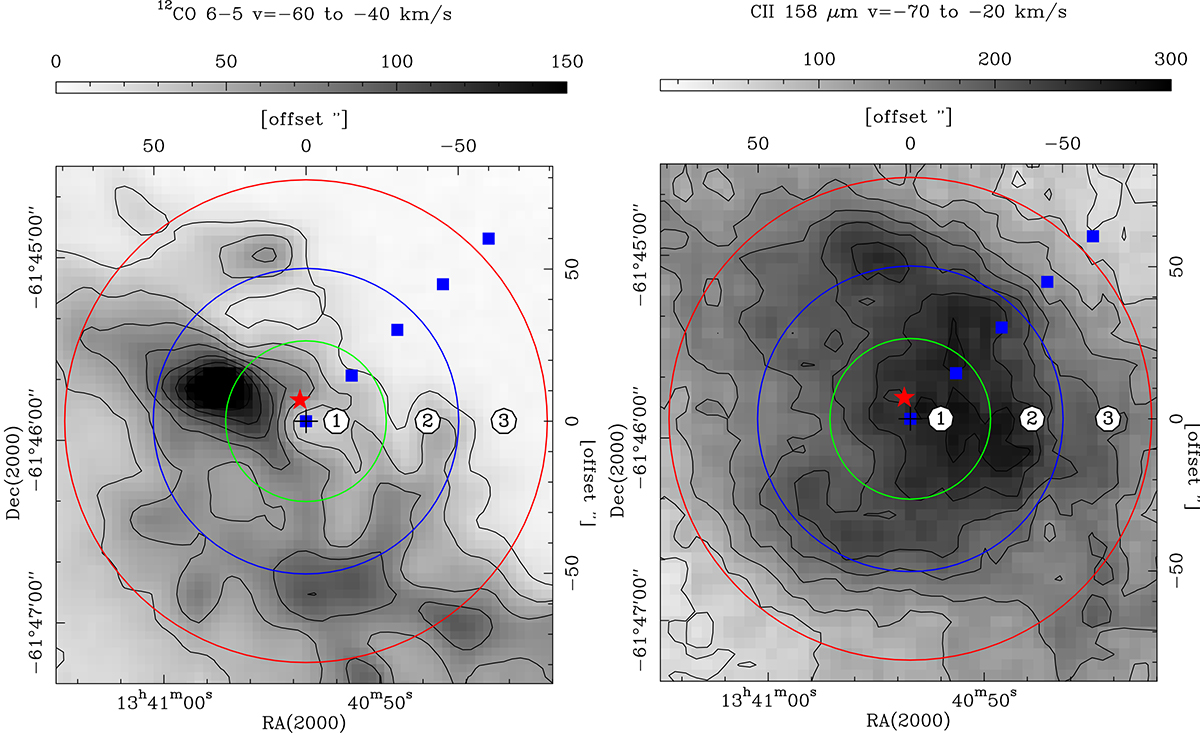
SimLine modeling setup of the C+ bubble overlaid on the observed 12CO 6 → 5 and [C II] intensities. The panels (12CO 6 → 5 on the left and [C II] on the right) show a sketch of the setup for an ideal 3D bubble (note that the calculations are in 1D) in which the different shell regions are indicated. The positions of observed and modeled spectra, shown in Fig. C.2, are indicated by blue squares. The red star marks the exciting O star of the cH IIR.
Current usage metrics show cumulative count of Article Views (full-text article views including HTML views, PDF and ePub downloads, according to the available data) and Abstracts Views on Vision4Press platform.
Data correspond to usage on the plateform after 2015. The current usage metrics is available 48-96 hours after online publication and is updated daily on week days.
Initial download of the metrics may take a while.