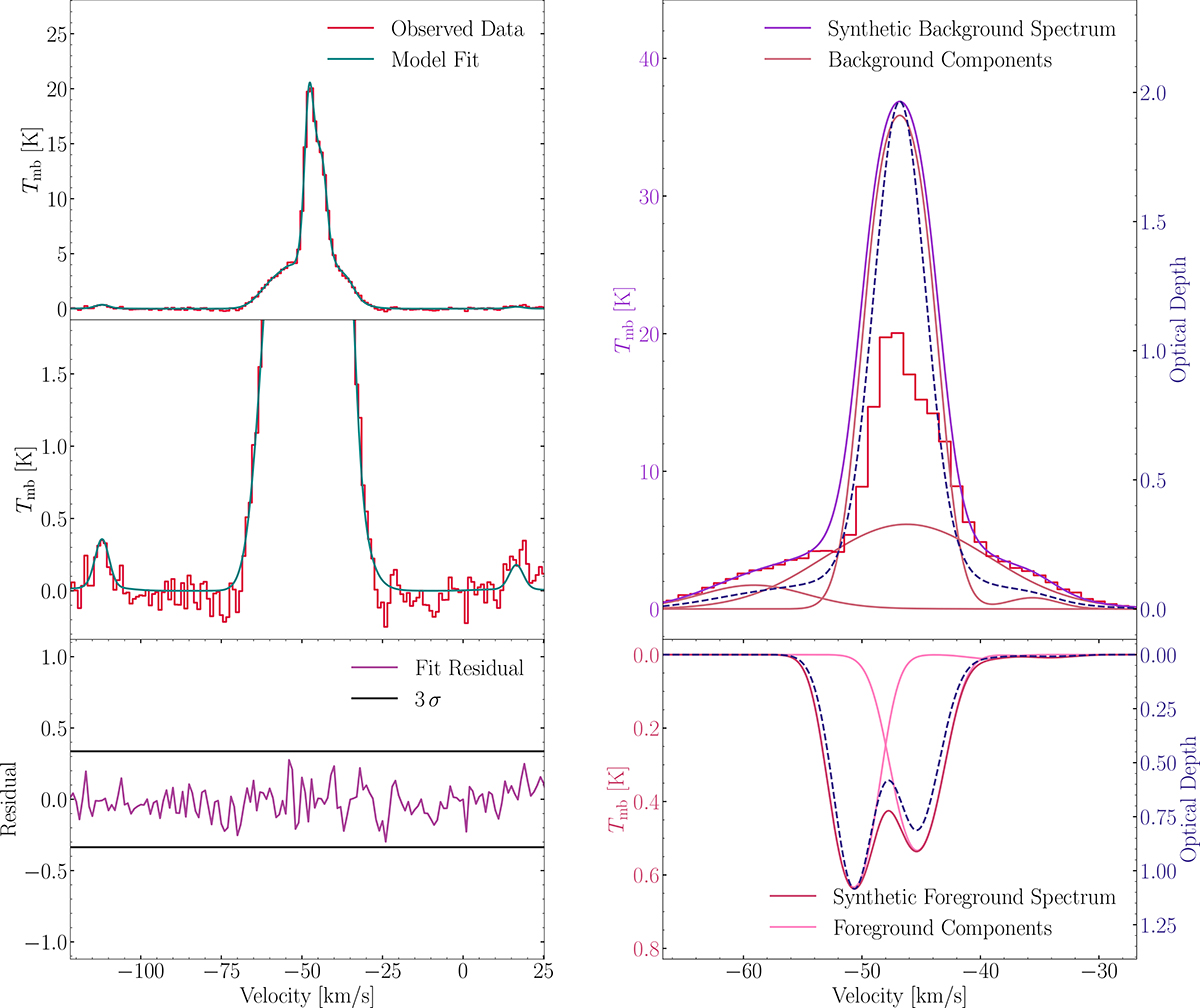
Fig. C.1.

Download original image
Two-layer model results for the average [C II] spectrum. The average spectrum corresponds to the area defined with dendrograms (refer to Fig. 2, right). The spectrum, shown in red, has a velocity resolution of 1 km s−1. The model’s background and foreground layer temperatures are Tex, bg = 80 K and Tex, fg = 20 K respectively. The upper left panel illustrates the observed spectrum in red beside its two-layer model fit in blue. The left central panel replicates the top panel’s data but expands the intensity axis for clearer viewing of the three [13C II] lines. The bottom left panel shows the residuals of the fit, with two horizontal black lines denoting the 3σ threshold. The top right panel focuses on individual background elements in red and the total background in violet. Meanwhile, the dashed blue curve represents velocity-resolved optical depth. The bottom right panel illustrates individual foreground elements in pink, alongside the overall foreground in red, again accompanying the dashed blue curve for optical depth representation.
Current usage metrics show cumulative count of Article Views (full-text article views including HTML views, PDF and ePub downloads, according to the available data) and Abstracts Views on Vision4Press platform.
Data correspond to usage on the plateform after 2015. The current usage metrics is available 48-96 hours after online publication and is updated daily on week days.
Initial download of the metrics may take a while.


