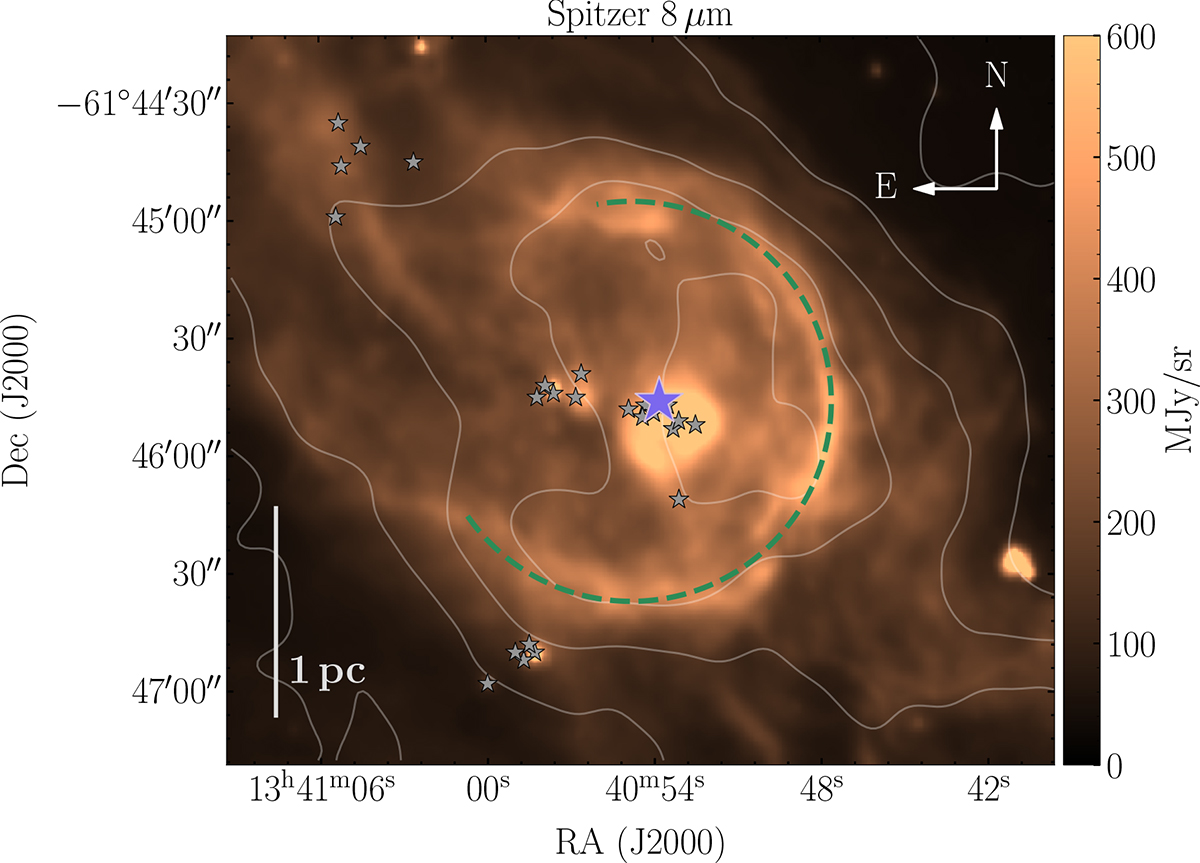
Fig. 1.
Download original image
Spitzer 8 μm image of the bubble at ∼2″ angular resolution from the GLIMPSE survey (Churchwell et al. 2006). The blue star is the O7.5–9.5V/III star and the small black stars are members of the associated IR clusters. The green circle is a by-eye approximation of the bright IR ring. The contour lines show [C II] emission from 50 to 250 K km s−1 in steps of 50 K km s−1.
Current usage metrics show cumulative count of Article Views (full-text article views including HTML views, PDF and ePub downloads, according to the available data) and Abstracts Views on Vision4Press platform.
Data correspond to usage on the plateform after 2015. The current usage metrics is available 48-96 hours after online publication and is updated daily on week days.
Initial download of the metrics may take a while.