Fig. 5
Download original image
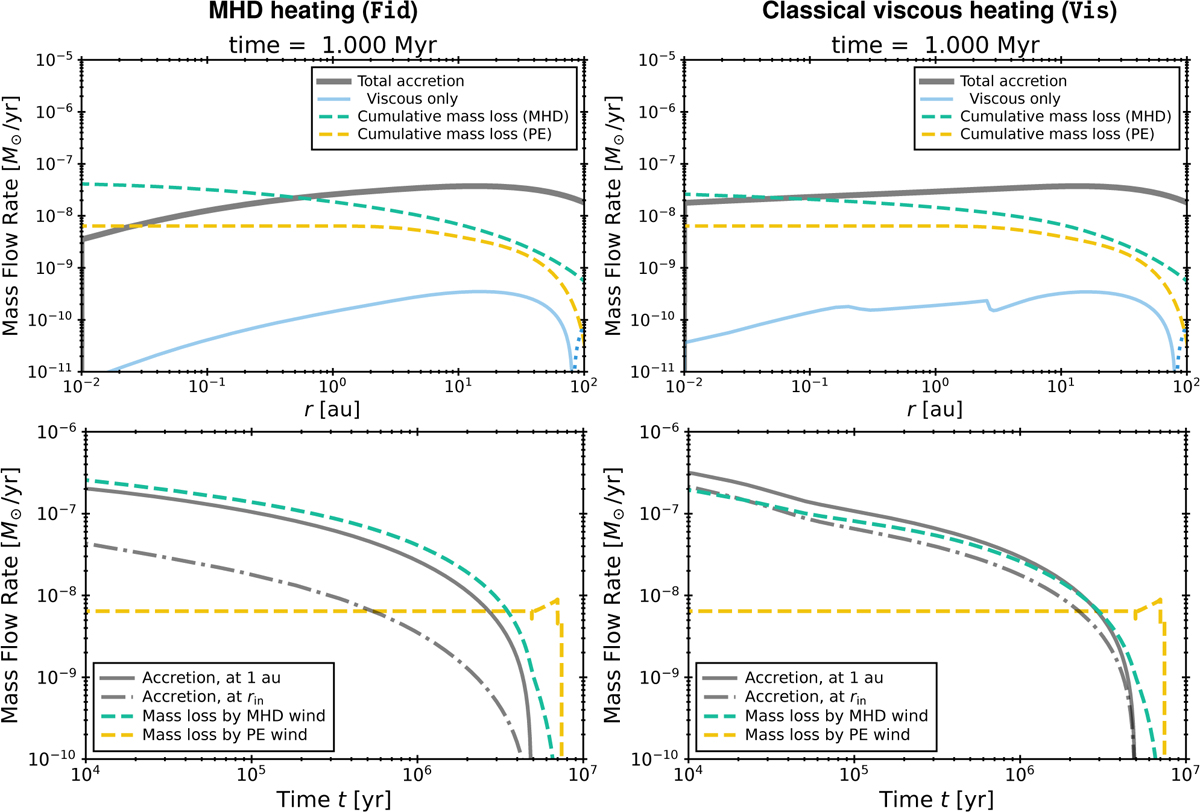
Top: radial profiles of the accretion rate (gray) and the cumulative mass-loss rate due to MHD (dashed green) and photoevaporative winds (dashed yellow) at t = 1 Myr after disk formation. The accretion rate solely due to viscous stress is indicated by blue lines. Model Fid is shown in the left panels, and Vis is shown in the right panels. Bottom: Time evolutions of the accretion rate measured at r = rin (= 0.01 au; solid gray) and r = 1 au (dashed gray). The total mass-loss rates by the MHD (dashed green lines) and photoevaporative winds (solid yellow) are also shown.
Current usage metrics show cumulative count of Article Views (full-text article views including HTML views, PDF and ePub downloads, according to the available data) and Abstracts Views on Vision4Press platform.
Data correspond to usage on the plateform after 2015. The current usage metrics is available 48-96 hours after online publication and is updated daily on week days.
Initial download of the metrics may take a while.