Fig. 3
Download original image
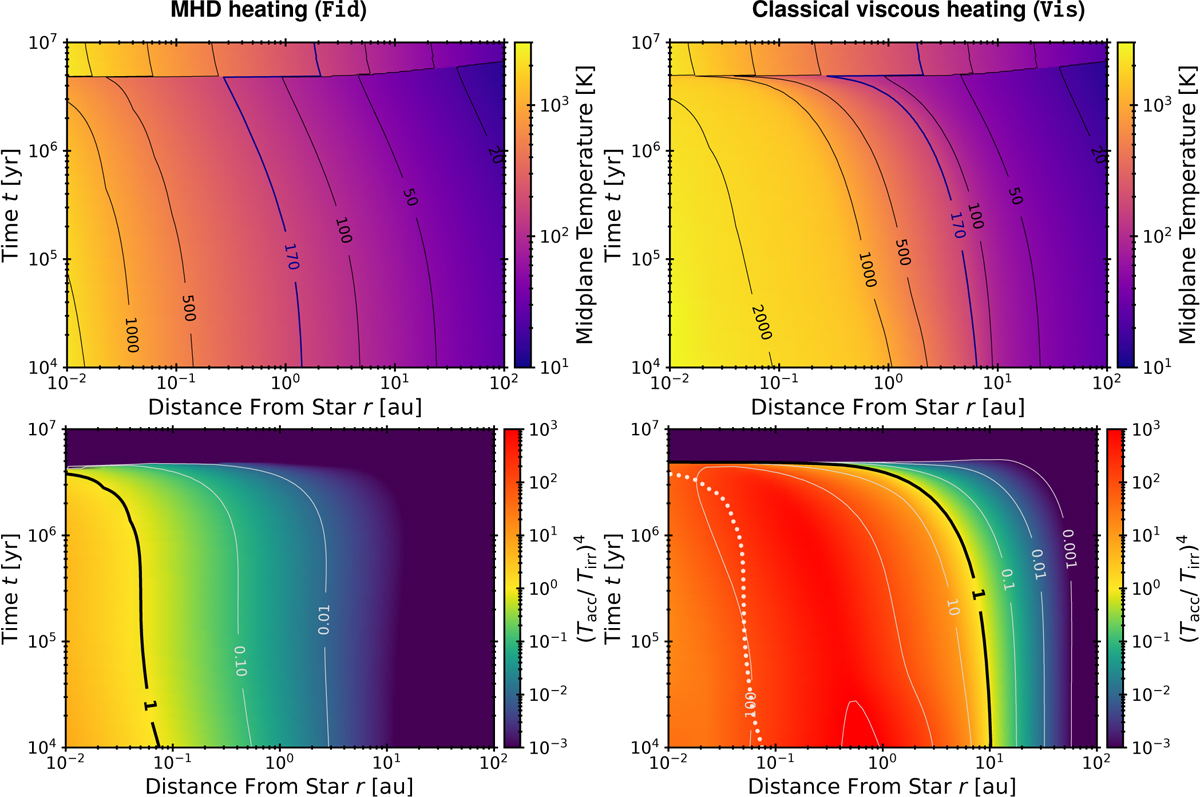
Top: space–time distribution of the midplane temperature. The location of the snowline (Tmid = 170 K) is denoted by the thicker solid line. Bottom: space–time distribution of the fourth power of the temperature ratio (Tacc/Tirr)4 between accretion heating and irradiation heating, indicating the contribution of accretion heating to the disk temperature. The dotted white line shows the boundary of the accretion-heated region (i.e., (Tacc/Tirr)4 = 1) in Fid for reference.
Current usage metrics show cumulative count of Article Views (full-text article views including HTML views, PDF and ePub downloads, according to the available data) and Abstracts Views on Vision4Press platform.
Data correspond to usage on the plateform after 2015. The current usage metrics is available 48-96 hours after online publication and is updated daily on week days.
Initial download of the metrics may take a while.