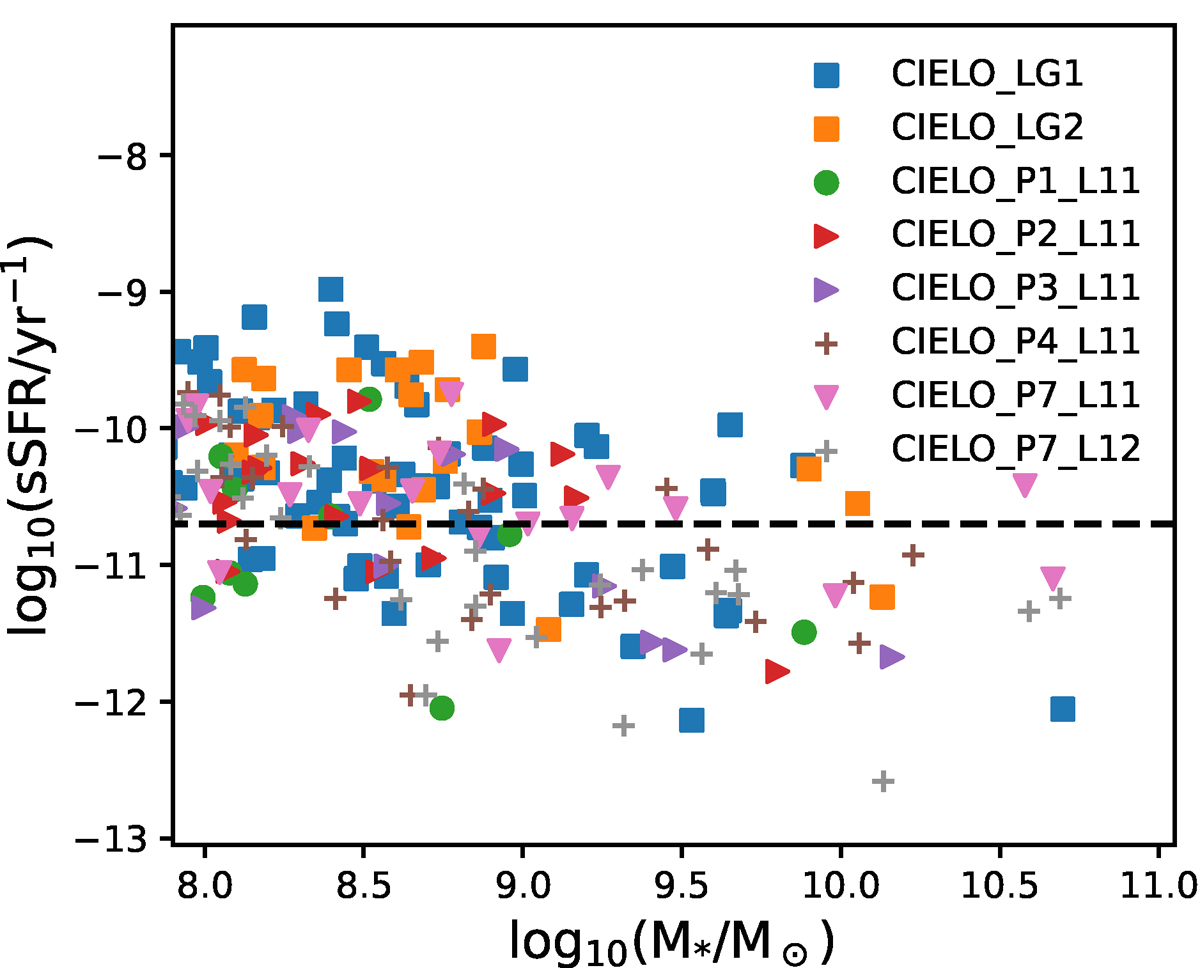
Fig. 8.
Download original image
sSFR as a function of stellar mass for galaxies with M⋆ ≥ 108 M⊙. To increase the statistics satellites galaxies within the same mass range are also included. The dashed line depicts the adopted limit for star-forming galaxies of log10(sSFR yr−1) = 10−10.8. Galaxies tend to have lower sSFR at the higher mass end (see also Fig. 9).
Current usage metrics show cumulative count of Article Views (full-text article views including HTML views, PDF and ePub downloads, according to the available data) and Abstracts Views on Vision4Press platform.
Data correspond to usage on the plateform after 2015. The current usage metrics is available 48-96 hours after online publication and is updated daily on week days.
Initial download of the metrics may take a while.