Fig. 7.
Download original image
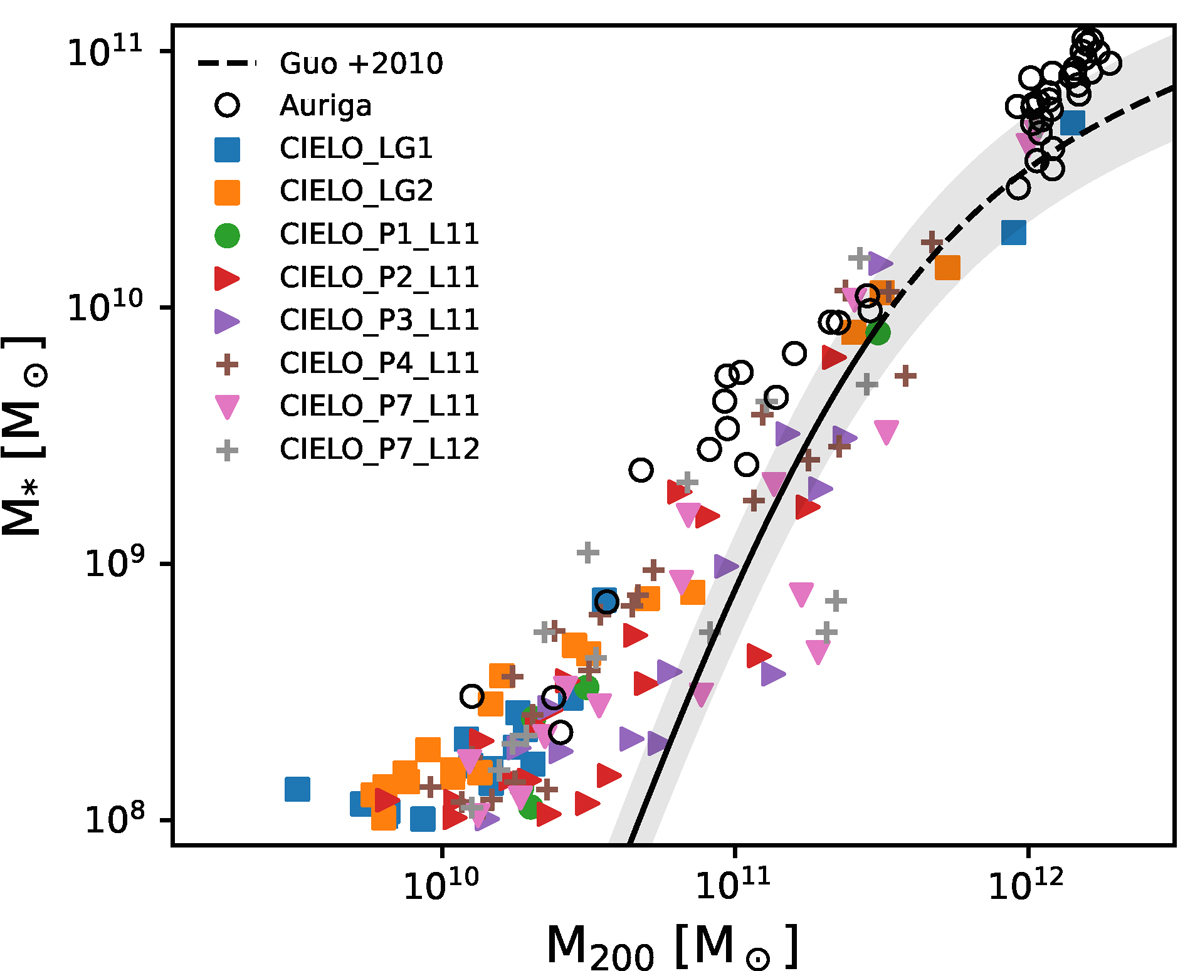
Stellar mass as a function of M200 for the central galaxies of haloes with M* ≥ 108 M⊙ for the all analysed simulations (see labels in the inset). For comparison, the relation proposed by Guo et al. (2010) (dashed line and the extrapolation for halo masses lower than 1011.5 indicated by the solid line) and trend for the L4 Auriga galaxies (Grand et al. 2024) are also included (open, black circles).
Current usage metrics show cumulative count of Article Views (full-text article views including HTML views, PDF and ePub downloads, according to the available data) and Abstracts Views on Vision4Press platform.
Data correspond to usage on the plateform after 2015. The current usage metrics is available 48-96 hours after online publication and is updated daily on week days.
Initial download of the metrics may take a while.