Open Access
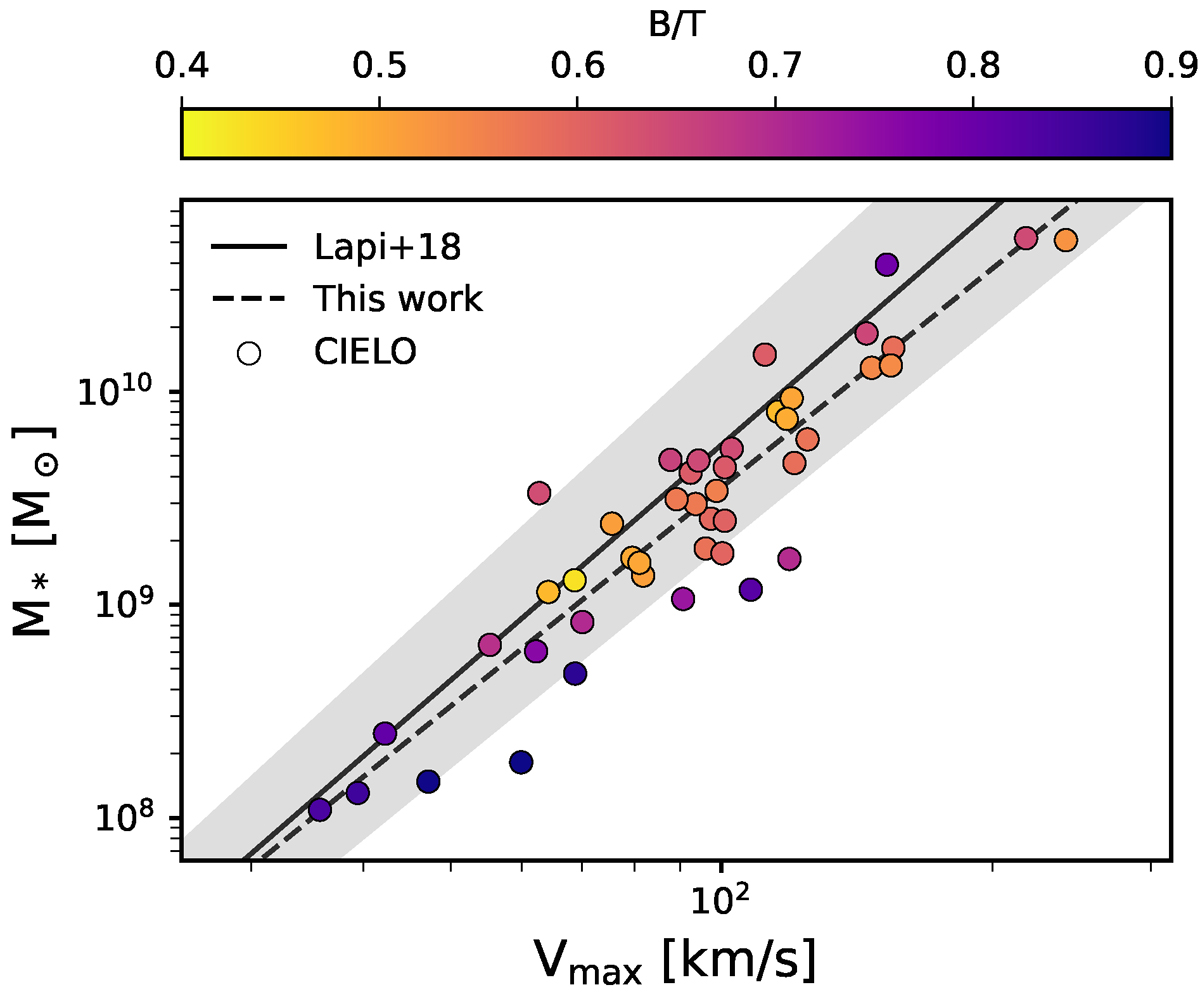
Fig. 11.
Download original image
Stellar TFR for the CIELO galaxies (circles). The linear regression fit is also displayed (dashed line). For comparison observational results for galaxies in the Local Universe by Lapi et al. (2018) has been included (solid line). The shaded region represents the observed standard deviation.
Current usage metrics show cumulative count of Article Views (full-text article views including HTML views, PDF and ePub downloads, according to the available data) and Abstracts Views on Vision4Press platform.
Data correspond to usage on the plateform after 2015. The current usage metrics is available 48-96 hours after online publication and is updated daily on week days.
Initial download of the metrics may take a while.