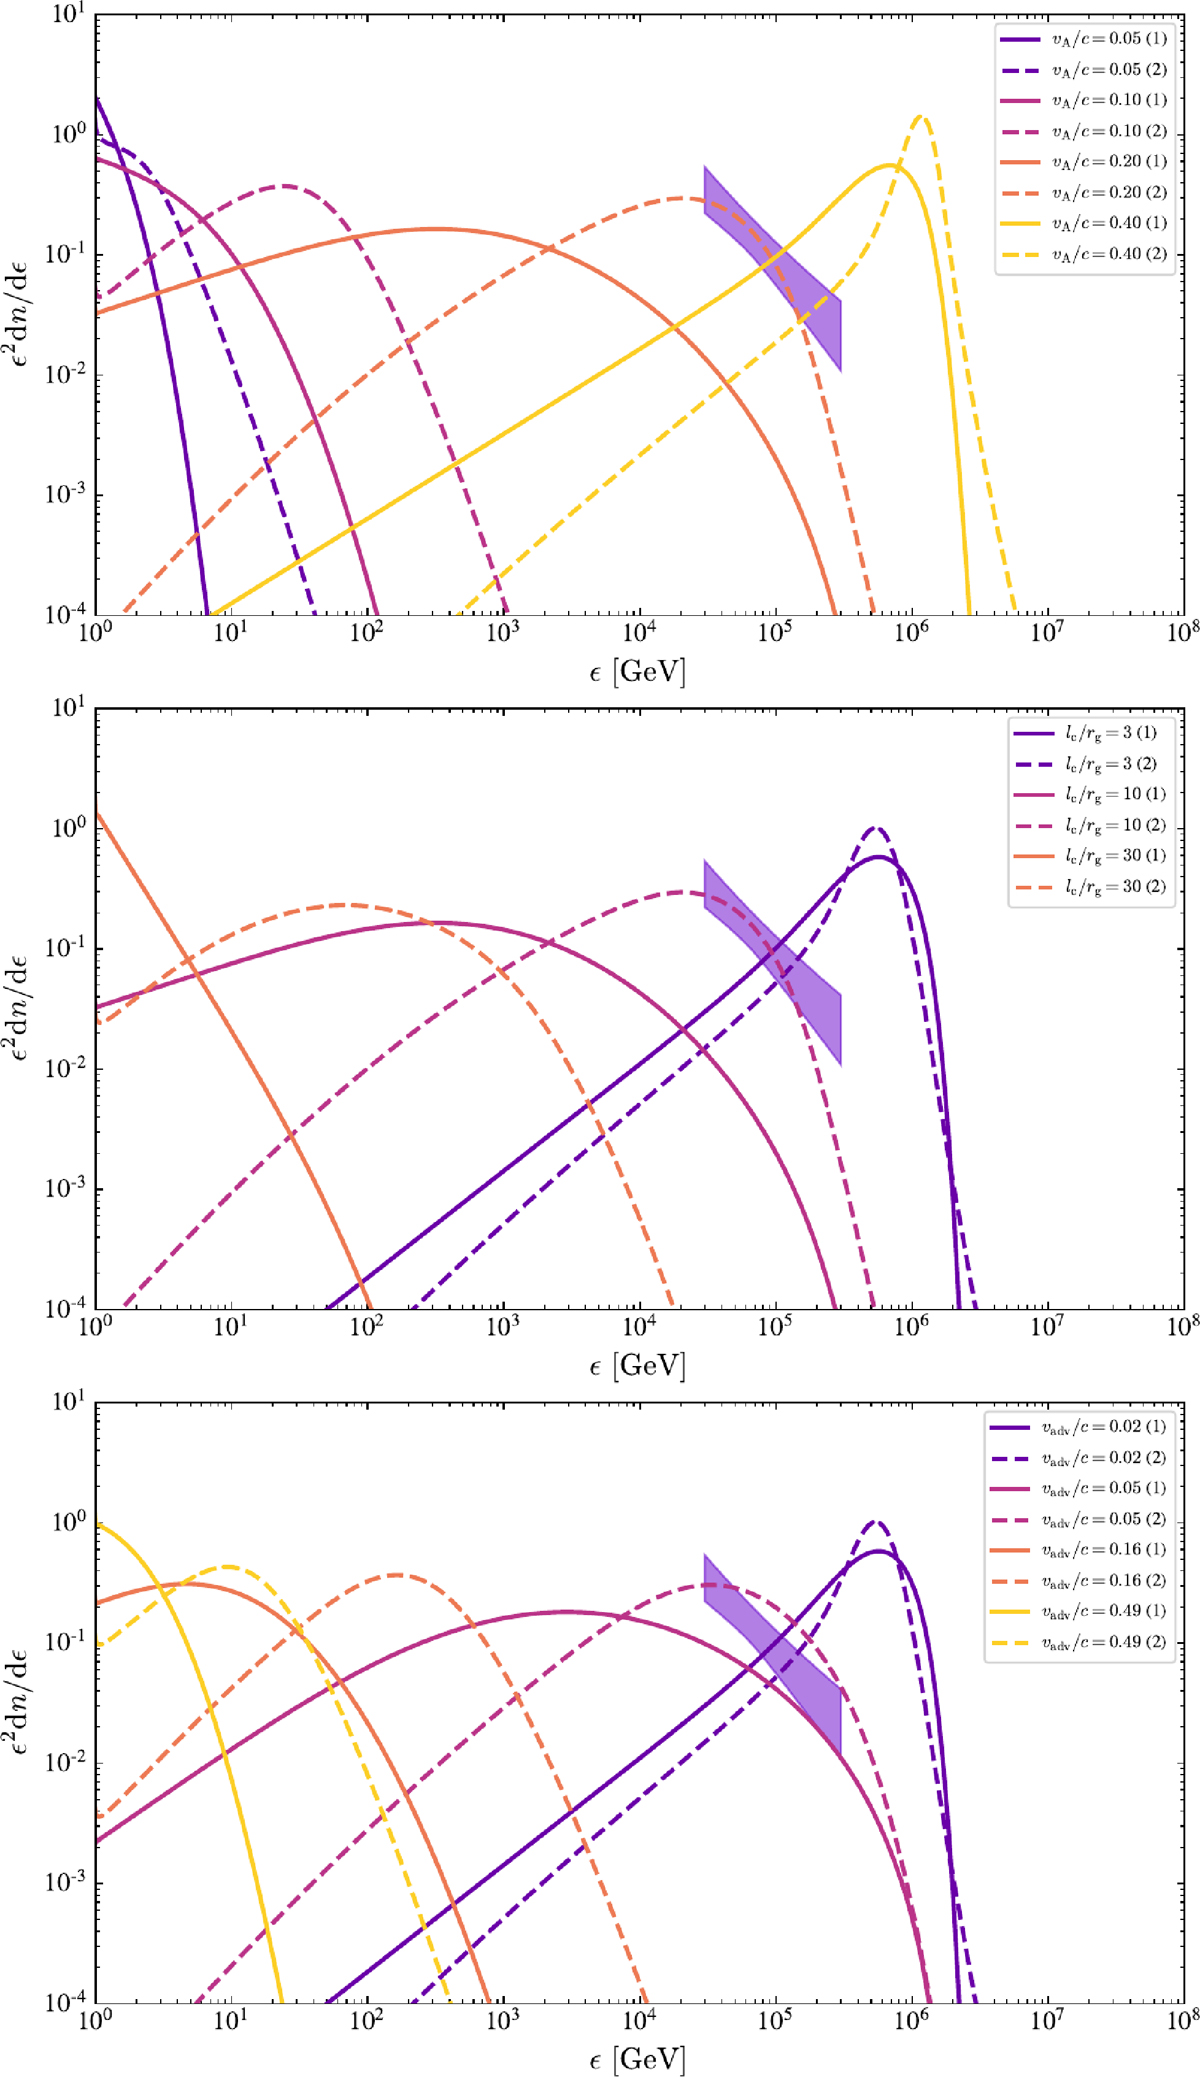
Fig. 1.
Download original image
Proton energy spectra ϵ2 dncor/dϵ (per log-interval of energy) vs. proton energy ϵ predicted by stochastic acceleration in a turbulent corona, starting from mono-energetic protons with a Lorentz factor of γ0 ∼ 1. In each panel, the solid line corresponds to a solution obtained by integrating the Fokker-Planck equation up to time τadv = rco/vadv (model (1) including energy losses, advection, and escape as described in the text), and the dashed line shows the corresponding solution for the same parameters for the generalized Fermi model described by Eq. (5) (model (2)). In all panels, rco is set to 30rg, and in the top and middle panels, vadv ≃ 0.02 c. The upper panel shows the dependence on vA, assuming otherwise a coherence length scale for the turbulence ℓc = 10 rg and an advection velocity vadv = 0.02 c. From left to right, as indicated, vA/c = 0.05, vA/c = 0.10, vA/c = 0.20, and vA/c = 0.40. The middle panel examines the dependence on ℓc, assuming otherwise vA/c = 0.20 and vadv/c = 0.02. From right to left, as indicated, ℓc = 3 rg, ℓc = 10 rg, and ℓc = 30 rg. The bottom panel examines the influence of advection, characterized here by the advection velocity vadv (which sets the advection timescale τadv ≡ rco/vadv), assuming otherwise vA/c = 0.20 and ℓc = 3 rg. From right to left, as indicated, vadv/c = 0.02, vadv/c = 0.05, vadv/c = 0.16 and a (more extreme) case vadv/c = 0.49. The butterfly indicates the range of values needed to reproduce a neutrino spectrum as observed by IceCube for NGC 1068. The energy density spectrum is expressed in units of the background plasma pressure (see Sect. 2.1). In these units, each individual spectrum has been normalized to an integrated fraction of unity for the sake of illustration.
Current usage metrics show cumulative count of Article Views (full-text article views including HTML views, PDF and ePub downloads, according to the available data) and Abstracts Views on Vision4Press platform.
Data correspond to usage on the plateform after 2015. The current usage metrics is available 48-96 hours after online publication and is updated daily on week days.
Initial download of the metrics may take a while.