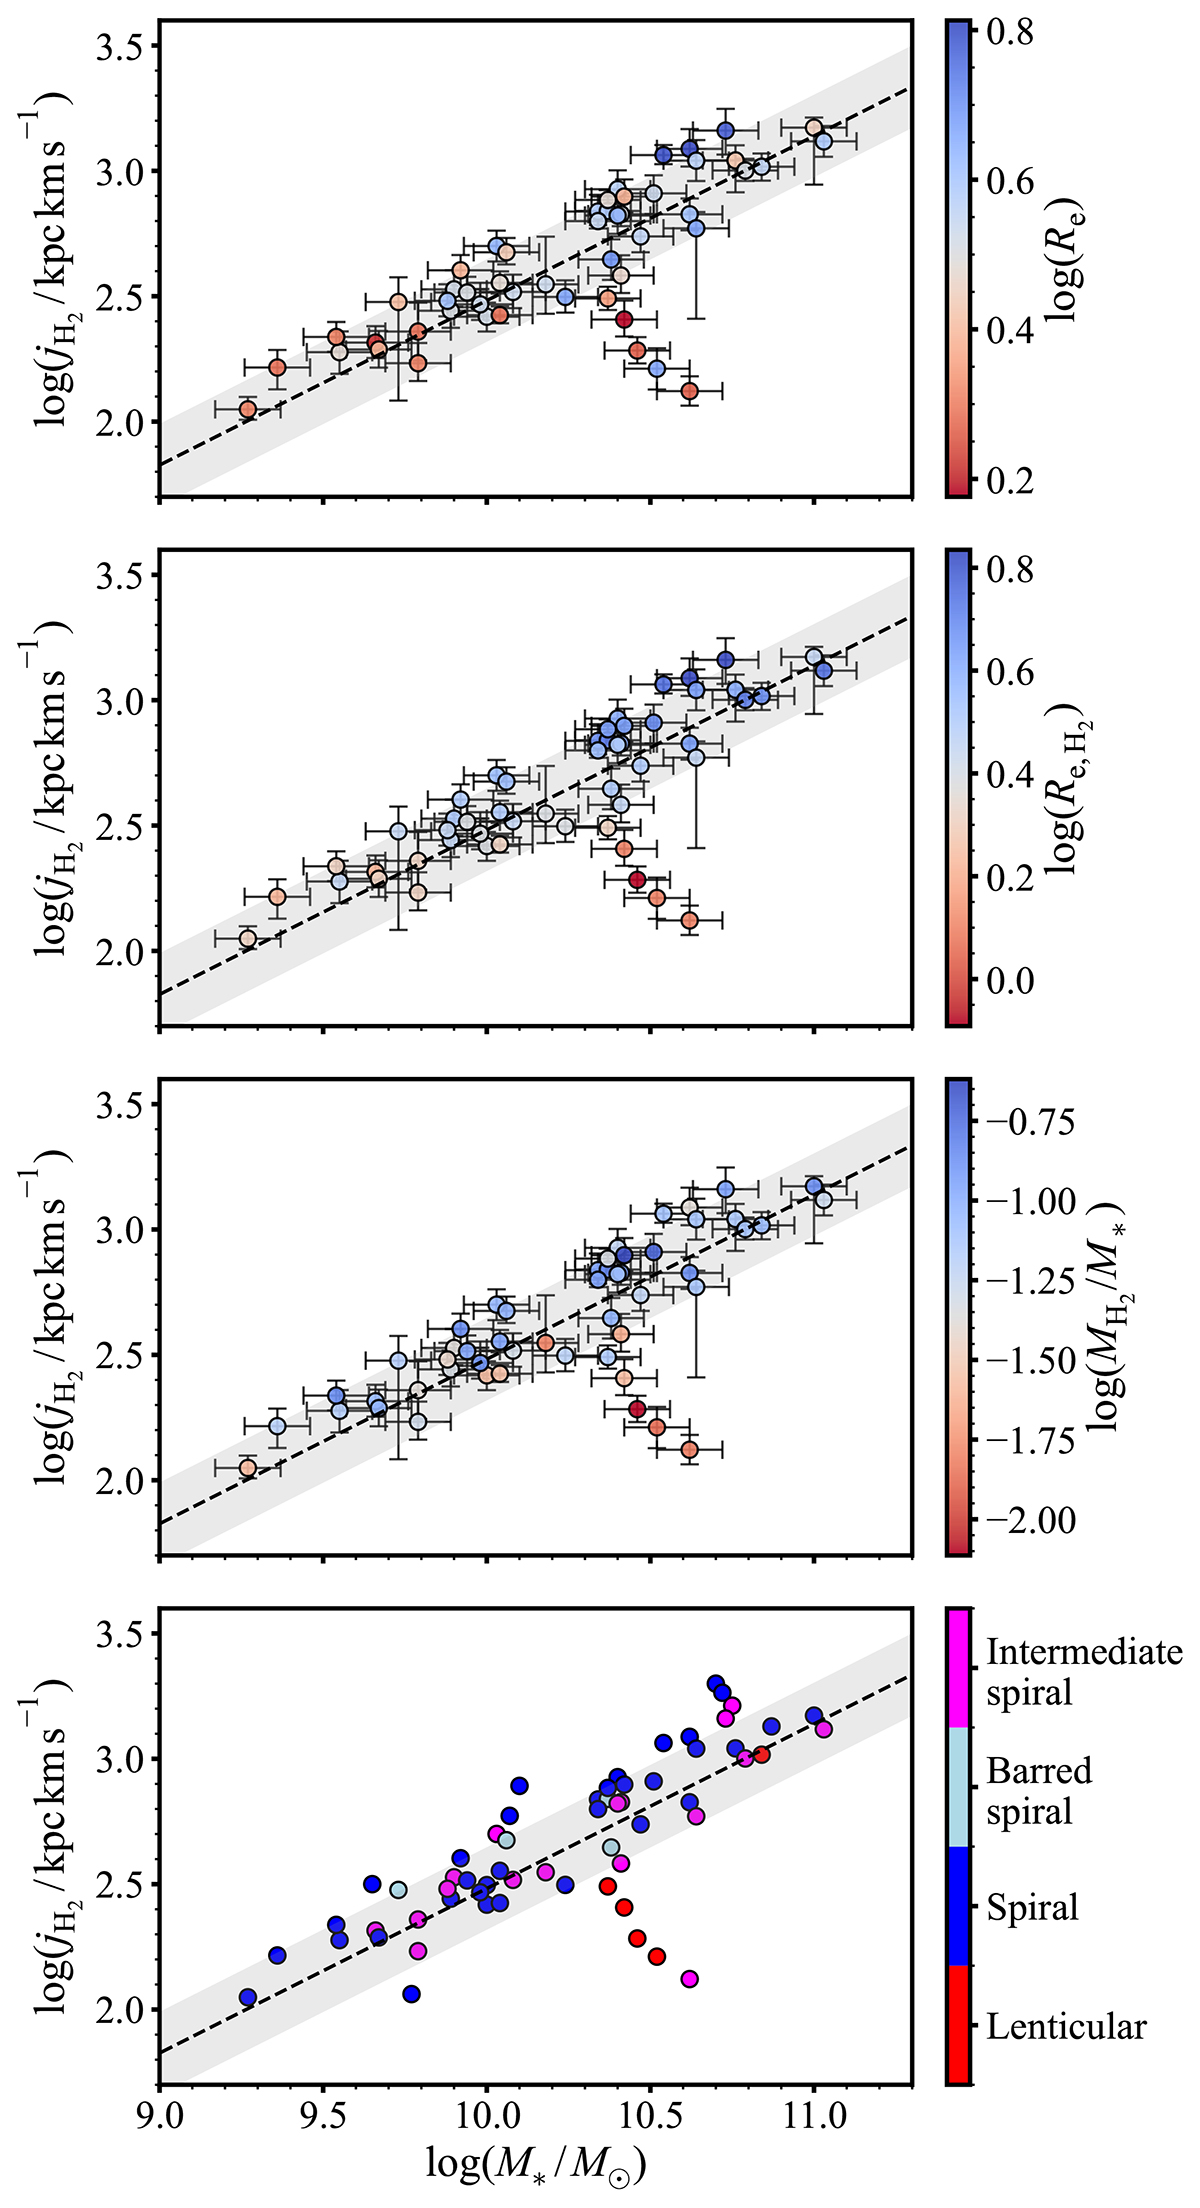
Fig. D.1.
Download original image
jH2 − M* relation for our converged sample, the dashed line and grey band indicate the best-fitting relation and its orthogonal intrinsic scatter, respectively. The panels highlight the dependence of the relation on the effective radius (top), Re, H2, the radius within which half of MH2 is contained (upper-middle), molecular gas fraction (lower-middle), and morphology (bottom).
Current usage metrics show cumulative count of Article Views (full-text article views including HTML views, PDF and ePub downloads, according to the available data) and Abstracts Views on Vision4Press platform.
Data correspond to usage on the plateform after 2015. The current usage metrics is available 48-96 hours after online publication and is updated daily on week days.
Initial download of the metrics may take a while.