Fig. 1.
Download original image
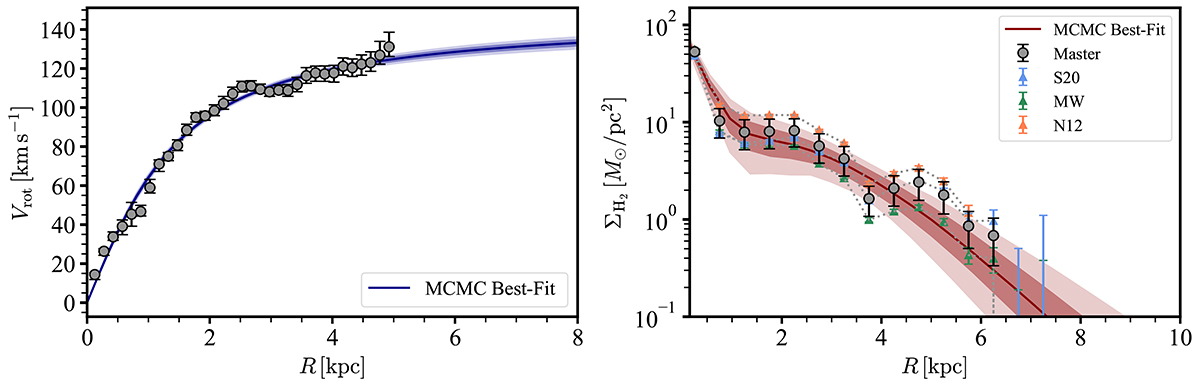
Example of the functional forms fitted to the rotational velocities and molecular gas surface density profiles (in this case for the galaxy IC 5273). Left: Observed rotation curve (grey markers with error bars) and the best-fit model (solid blue curve) with its 1σ and 2σ uncertainties represented by the shaded region. Right: Molecular gas surface density profile assuming our master αCO conversion factor (grey markers with error bars). The best-fit model is shown as a solid red curve, with its 1σ and 2σ uncertainties indicated by the shaded region. Profiles derived using alternative CO-to-H2 conversion factors (S20, MW, N12) are overplotted for comparison (B13 was not available for IC 5273). As can be seen, our profile represents a good compromise between the different calibrations and incorporates realistic uncertainties.
Current usage metrics show cumulative count of Article Views (full-text article views including HTML views, PDF and ePub downloads, according to the available data) and Abstracts Views on Vision4Press platform.
Data correspond to usage on the plateform after 2015. The current usage metrics is available 48-96 hours after online publication and is updated daily on week days.
Initial download of the metrics may take a while.