Fig. 11
Download original image
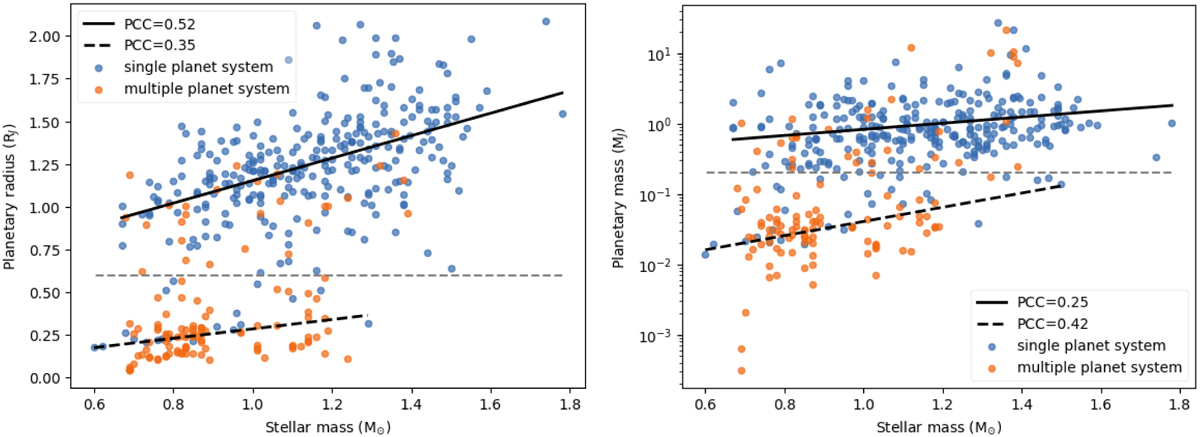
Left panel: planet radius as a function of stellar mass. The orange points indicate planets in multiple systems and the blue points are single planet systems. The dashed lines separates the smaller planets at 0.6 RJ from giant planets. Right panel: planetary mass (in logarithmic scale) as function of stellar mass. The dashed grey lines separates the low-mass planets at 0.2 MJ from giant planets. The black lines represent the linear fits with their Pearson Correlation Coefficients between planetary mass and radius with stellar mass for giant planets (solid black line) and low-mass planets (dashed black line).
Current usage metrics show cumulative count of Article Views (full-text article views including HTML views, PDF and ePub downloads, according to the available data) and Abstracts Views on Vision4Press platform.
Data correspond to usage on the plateform after 2015. The current usage metrics is available 48-96 hours after online publication and is updated daily on week days.
Initial download of the metrics may take a while.