Fig. 5
Download original image
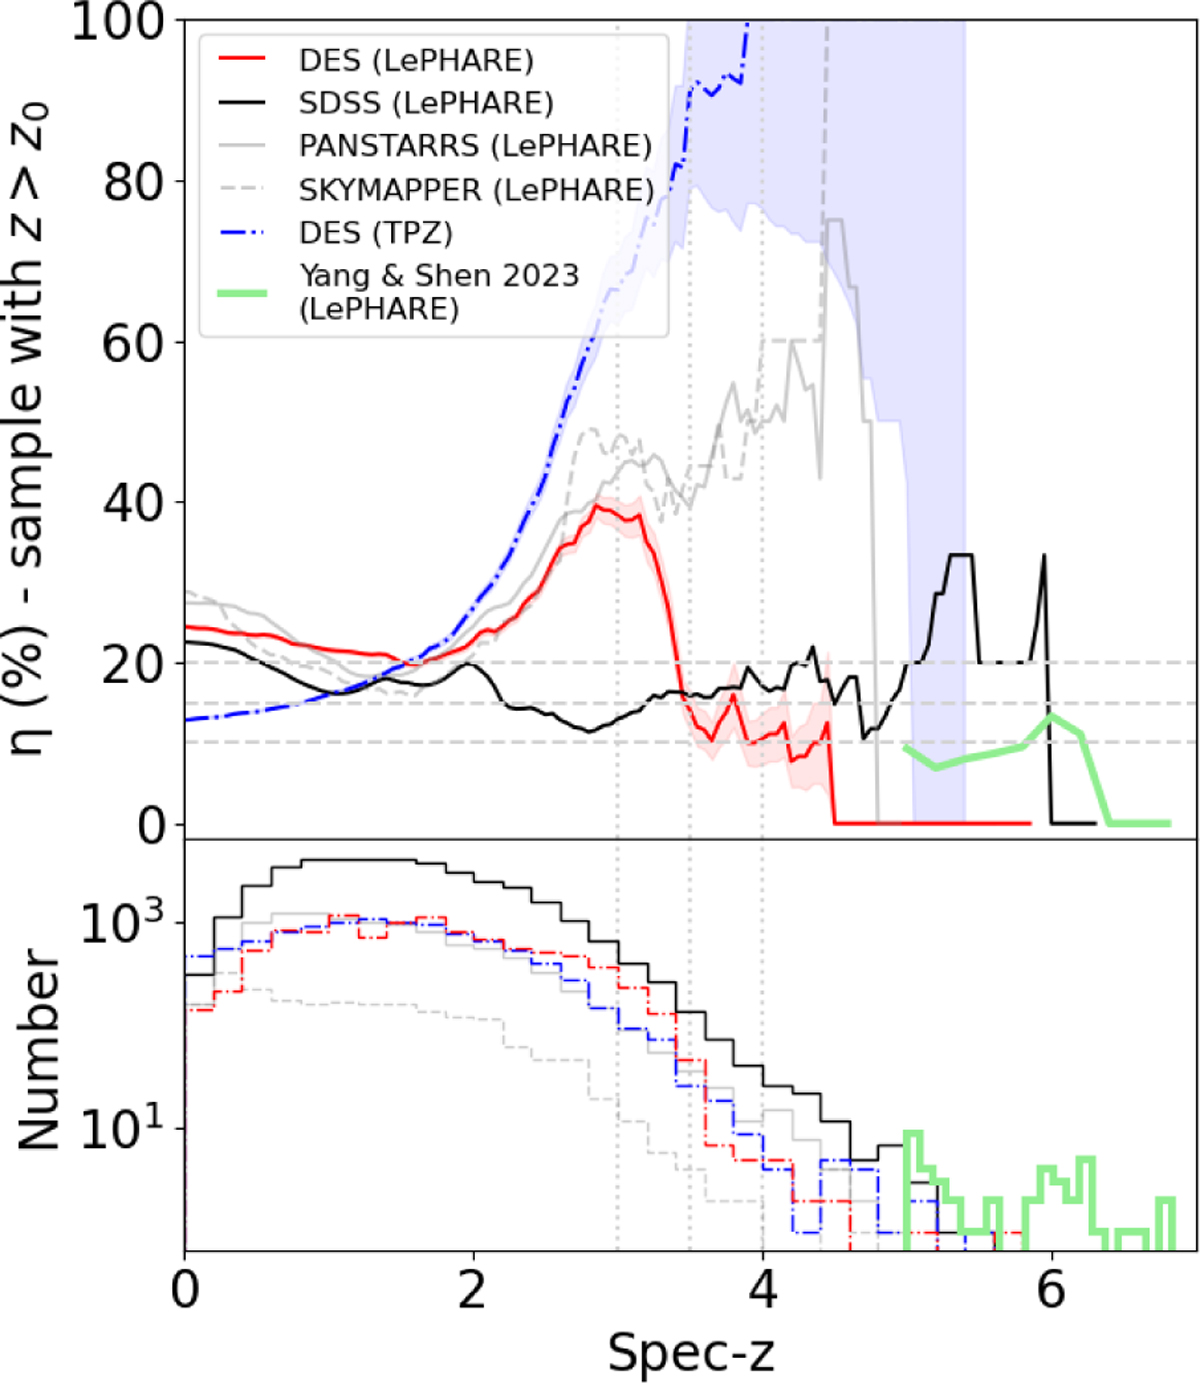
Percentage of outliers versus spectroscopic redshift (upper panel) for the point-like sources. At each redshift, we calculate the percentage of outliers for all sources above this redshift. The bottom panel show the distribution of the training samples with available spectroscopic information. The performance in the DES field using TPZ (blue-dashed-dotted) and LePHARE (red-solid) is compared across different redshifts. For reference, we show the performance of LePHARE algorithm for the 4XMM-DR13 sources using different optical photometry adopted from Ruiz et al., (in prep.), such as SDSS (black-solid), PANSTARRS (gray-solid) and SKYMAPPER (gray-dashed). Finally, we present the LePHARE performance of z ≥ 5 sources of Yang & Shen (2023).
Current usage metrics show cumulative count of Article Views (full-text article views including HTML views, PDF and ePub downloads, according to the available data) and Abstracts Views on Vision4Press platform.
Data correspond to usage on the plateform after 2015. The current usage metrics is available 48-96 hours after online publication and is updated daily on week days.
Initial download of the metrics may take a while.