Fig. 11
Download original image
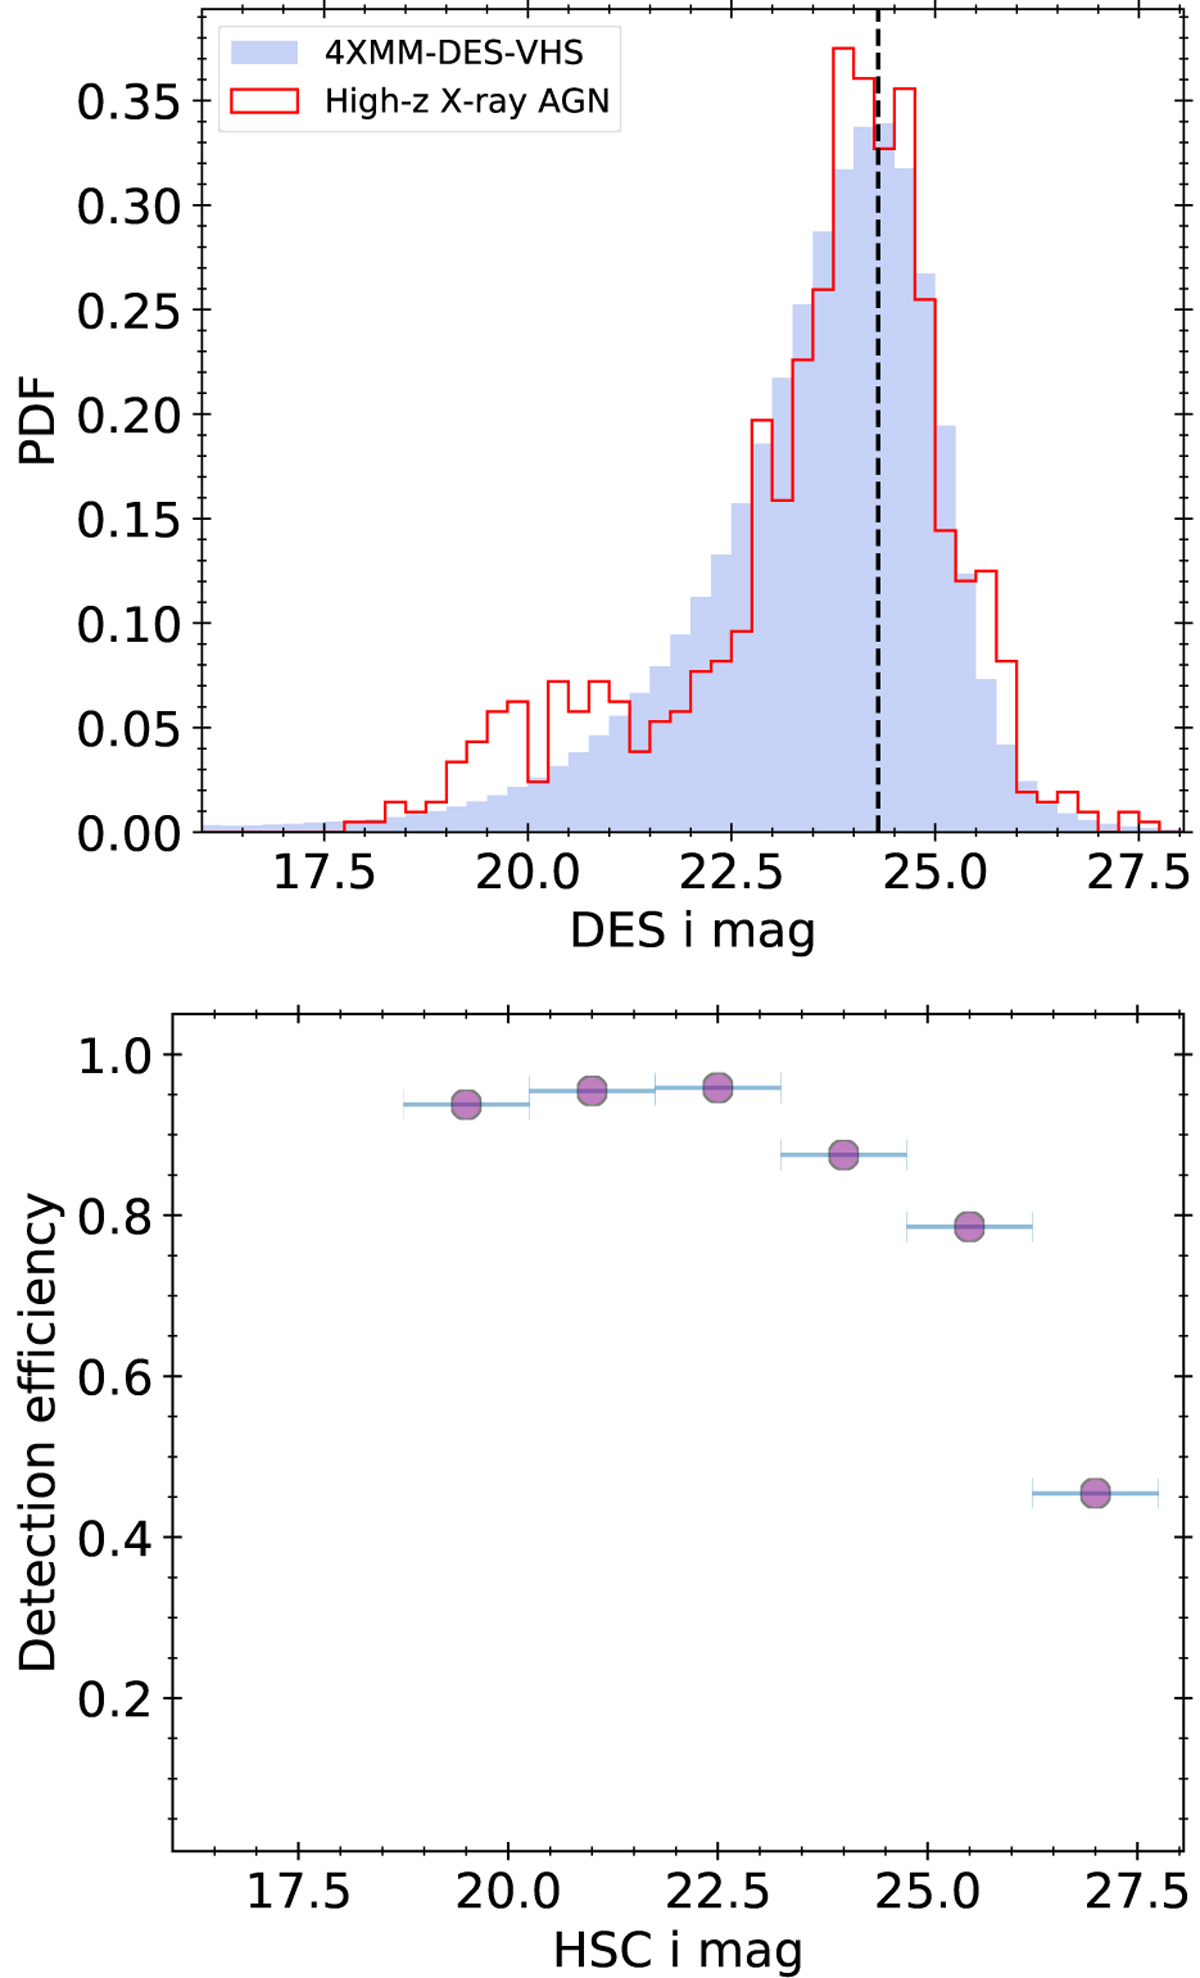
Upper panel: normalised histograms of the high-z X-ray AGN selected through our analysis (red) and the DES sources inside the 4XMM-DES-VHS footprint (blue) as a function of the DES i-band magnitude. The vertical line indicates the mode of the DES i-band magnitude distribution for the latter at iDES = 24.3 mag. Lower panel: fraction of high-z X-ray HSC sources that have a match with the DES DR2 catalogue.
Current usage metrics show cumulative count of Article Views (full-text article views including HTML views, PDF and ePub downloads, according to the available data) and Abstracts Views on Vision4Press platform.
Data correspond to usage on the plateform after 2015. The current usage metrics is available 48-96 hours after online publication and is updated daily on week days.
Initial download of the metrics may take a while.