Open Access
Fig. 7.
Download original image
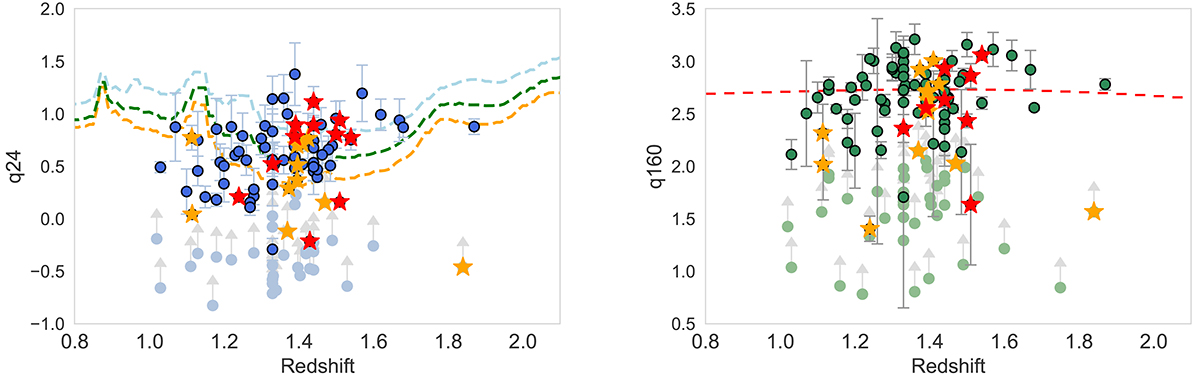
IR-radio correlation values of the full sample of 11 massive galaxy clusters vs. redshift for q24 (left) and q160 (right). The symbols and lines are the same as in Fig. 2. Previously identified AGNs are overplotted with yellow stars, and newly identified AGNs are plotted with red stars.
Current usage metrics show cumulative count of Article Views (full-text article views including HTML views, PDF and ePub downloads, according to the available data) and Abstracts Views on Vision4Press platform.
Data correspond to usage on the plateform after 2015. The current usage metrics is available 48-96 hours after online publication and is updated daily on week days.
Initial download of the metrics may take a while.