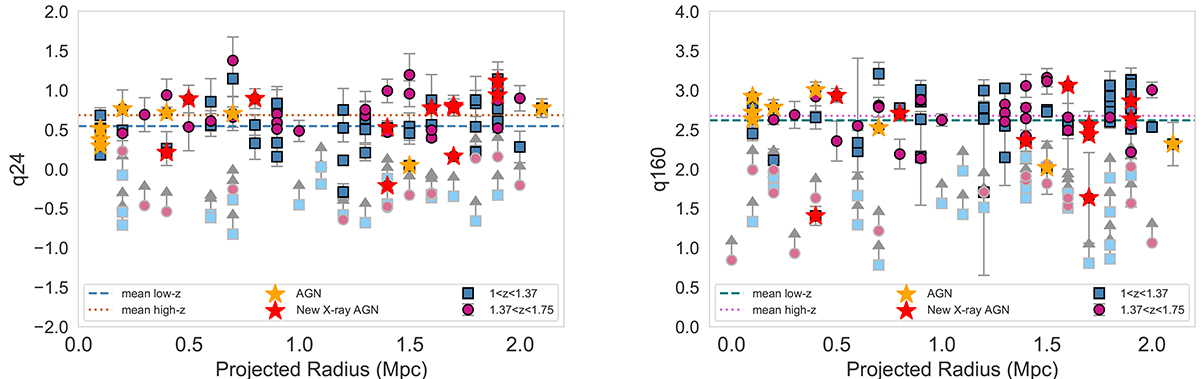
Fig. 6.
Download original image
q24 (left) and q160 (right) values of two redshift bins as a function of R. Low-z galaxies are plotted as filled blue squares, and high-z galaxies are plotted as filled violet circles. The lower limit of the q values of the low-z sample is plotted as filled light blue squares, and the lower limit of the high-z sample is plotted as filled light violet circles. Previously identified AGNs are overplotted with yellow stars, and newly identified AGNs are plotted with red stars. The mean correlation parameter values of the low- and high-redshift subsamples are shown with dashed and dotted lines, respectively.
Current usage metrics show cumulative count of Article Views (full-text article views including HTML views, PDF and ePub downloads, according to the available data) and Abstracts Views on Vision4Press platform.
Data correspond to usage on the plateform after 2015. The current usage metrics is available 48-96 hours after online publication and is updated daily on week days.
Initial download of the metrics may take a while.