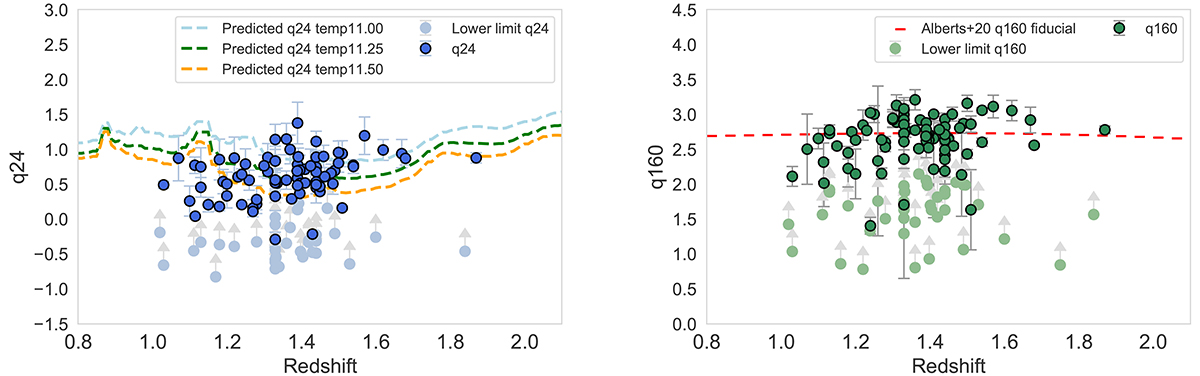
Fig. 2.
Download original image
IR-radio correlation values of the full sample of 11 massive galaxy clusters vs. redshift. Sources with detections in the IR and radio were used to determine the values of q24 (left) and q160 (right) that are shown as blue and green points, respectively. Sources that were only detected in the IR are lower limits and are shown as light blue and light green points with upper gray arrows. The error bars were derived from the propagation errors. The dashed sky blue, green, and orange lines indicate representative SFG templates from Rieke et al. (2009) at log(LIR/L⊙) = [11.00, 11.25, 11.50] for q24. The dashed red line represents the fiducial q160 from Alberts et al. (2020).
Current usage metrics show cumulative count of Article Views (full-text article views including HTML views, PDF and ePub downloads, according to the available data) and Abstracts Views on Vision4Press platform.
Data correspond to usage on the plateform after 2015. The current usage metrics is available 48-96 hours after online publication and is updated daily on week days.
Initial download of the metrics may take a while.