Open Access
Fig. 3.
Download original image
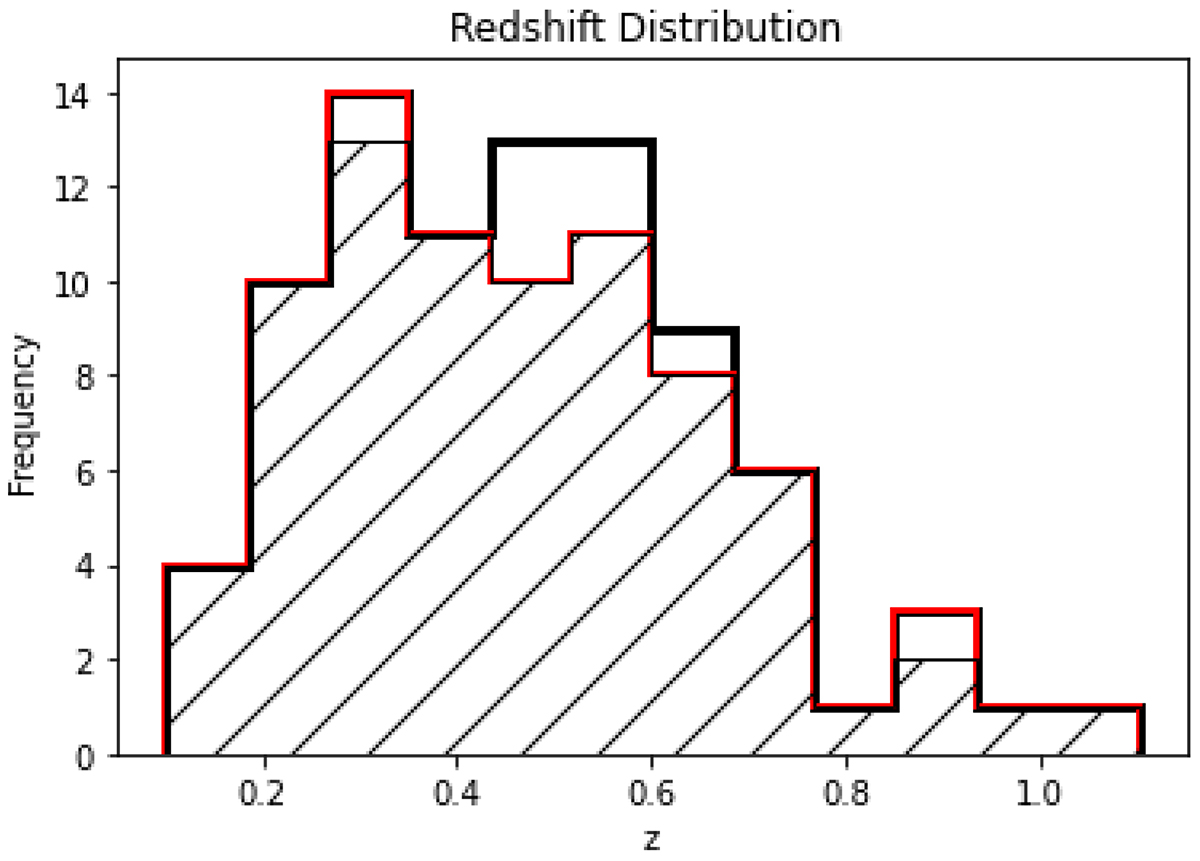
Normalised redshift distribution. The hatched area corresponds to the main sample of 82 X-ray detected AGN in clusters while the black line and the red line correspond to the 166 field X-ray AGN (sub-sample ii) and the 208 clusters galaxies (sub-sample iv), respectively.
Current usage metrics show cumulative count of Article Views (full-text article views including HTML views, PDF and ePub downloads, according to the available data) and Abstracts Views on Vision4Press platform.
Data correspond to usage on the plateform after 2015. The current usage metrics is available 48-96 hours after online publication and is updated daily on week days.
Initial download of the metrics may take a while.