Open Access
Fig. 2.
Download original image
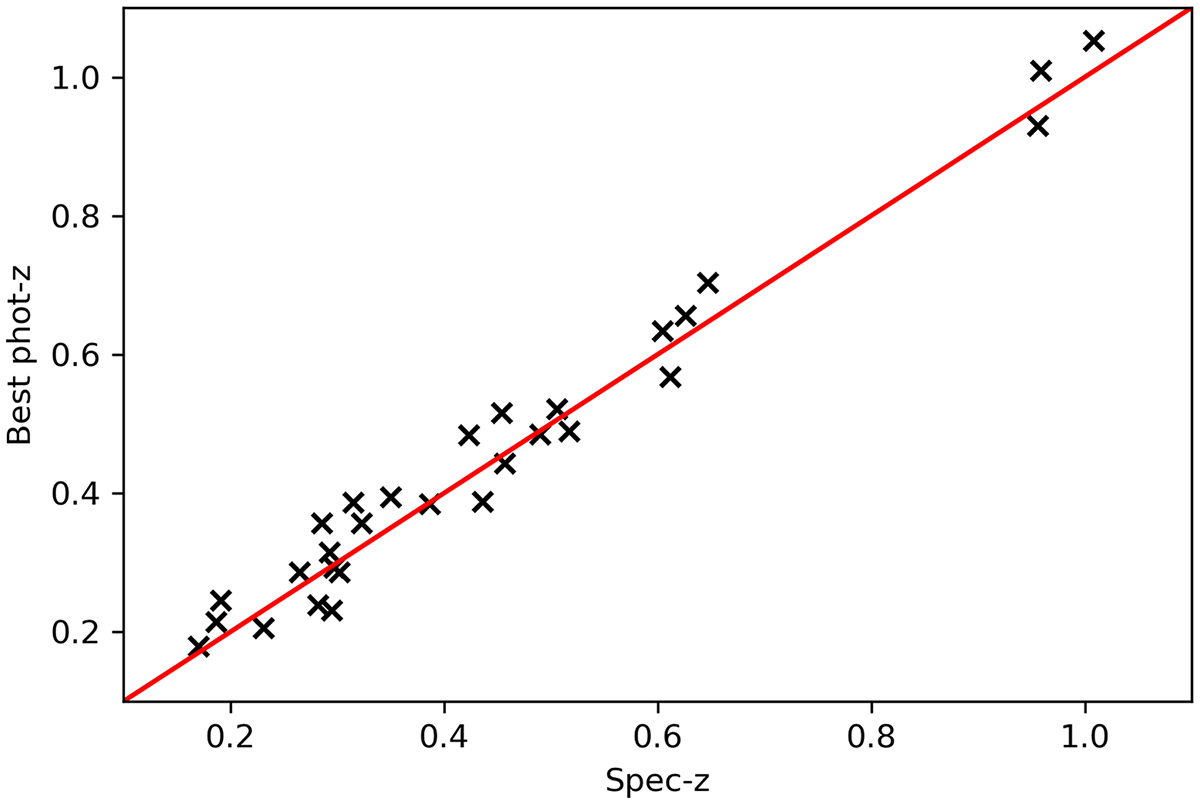
Spectroscopic versus photometric redshift scatter plot of the spectroscopically confirmed X-ray detected AGN in clusters. The sources were selected based on specific photometric redshift criteria, as described in Sect. 2.3. The red line denotes the equality.
Current usage metrics show cumulative count of Article Views (full-text article views including HTML views, PDF and ePub downloads, according to the available data) and Abstracts Views on Vision4Press platform.
Data correspond to usage on the plateform after 2015. The current usage metrics is available 48-96 hours after online publication and is updated daily on week days.
Initial download of the metrics may take a while.