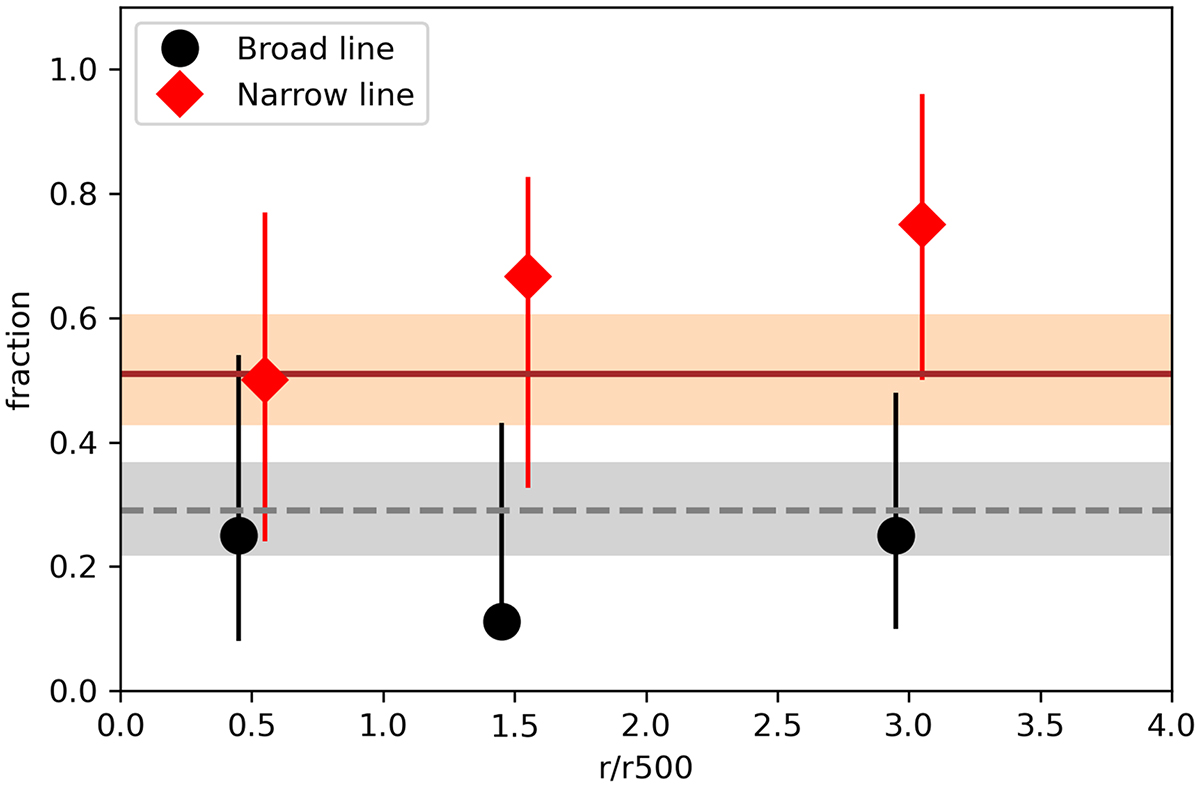
Fig. 11.
Download original image
AGN optical classification of X-ray AGN in clusters (black circles for broad-line and red squares for narrow-line AGN) compared to the control sample of field X-ray AGN (dashed black line for broad-line and continuous red line for narrow-line AGN). The classification and detailed results are described in Sect. 3.2.1 and Sect. 4.2.1. Error bars and shaded areas indicate the 1σ confidence limits for small numbers of events (Gehrels 1986).
Current usage metrics show cumulative count of Article Views (full-text article views including HTML views, PDF and ePub downloads, according to the available data) and Abstracts Views on Vision4Press platform.
Data correspond to usage on the plateform after 2015. The current usage metrics is available 48-96 hours after online publication and is updated daily on week days.
Initial download of the metrics may take a while.