Fig. 9
Download original image
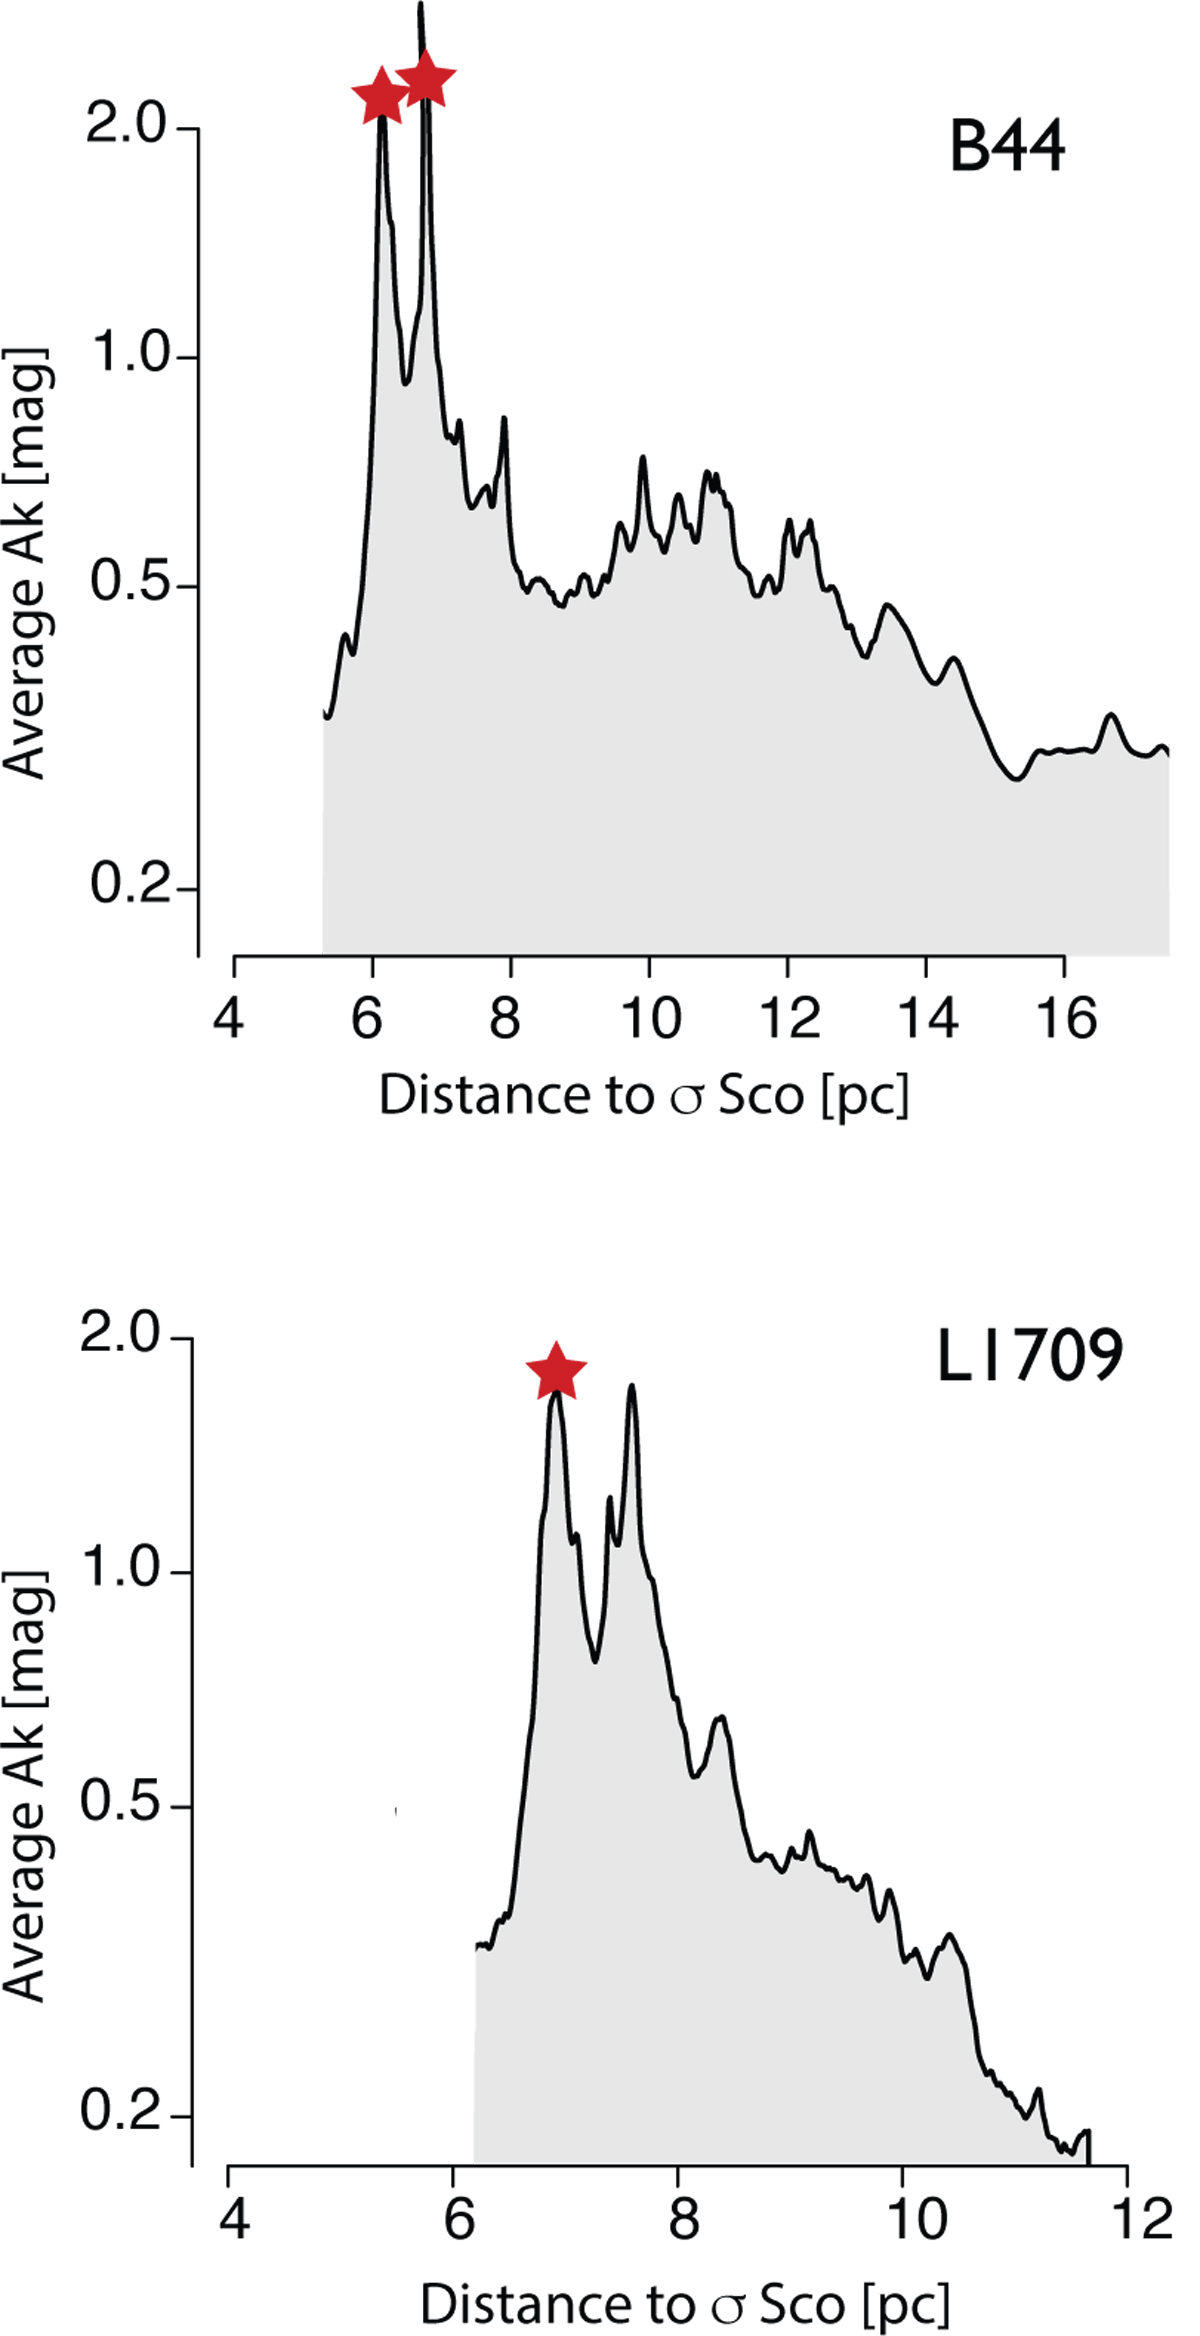
Longitudinal mass profiles of Ophiuchus’s densest R-type filaments (B44 and L1709 at B45’s head) at Herschel’s higher resolution. As in the lower-resolution Planck-based profile in Figure 6, the linear mass density decreases from the head, closest to the massive stars, toward the tail. Class I protostars, tracers of ongoing star formation, are shown as red stars and associated with the maxima of the profile.
Current usage metrics show cumulative count of Article Views (full-text article views including HTML views, PDF and ePub downloads, according to the available data) and Abstracts Views on Vision4Press platform.
Data correspond to usage on the plateform after 2015. The current usage metrics is available 48-96 hours after online publication and is updated daily on week days.
Initial download of the metrics may take a while.