Fig. 4
Download original image
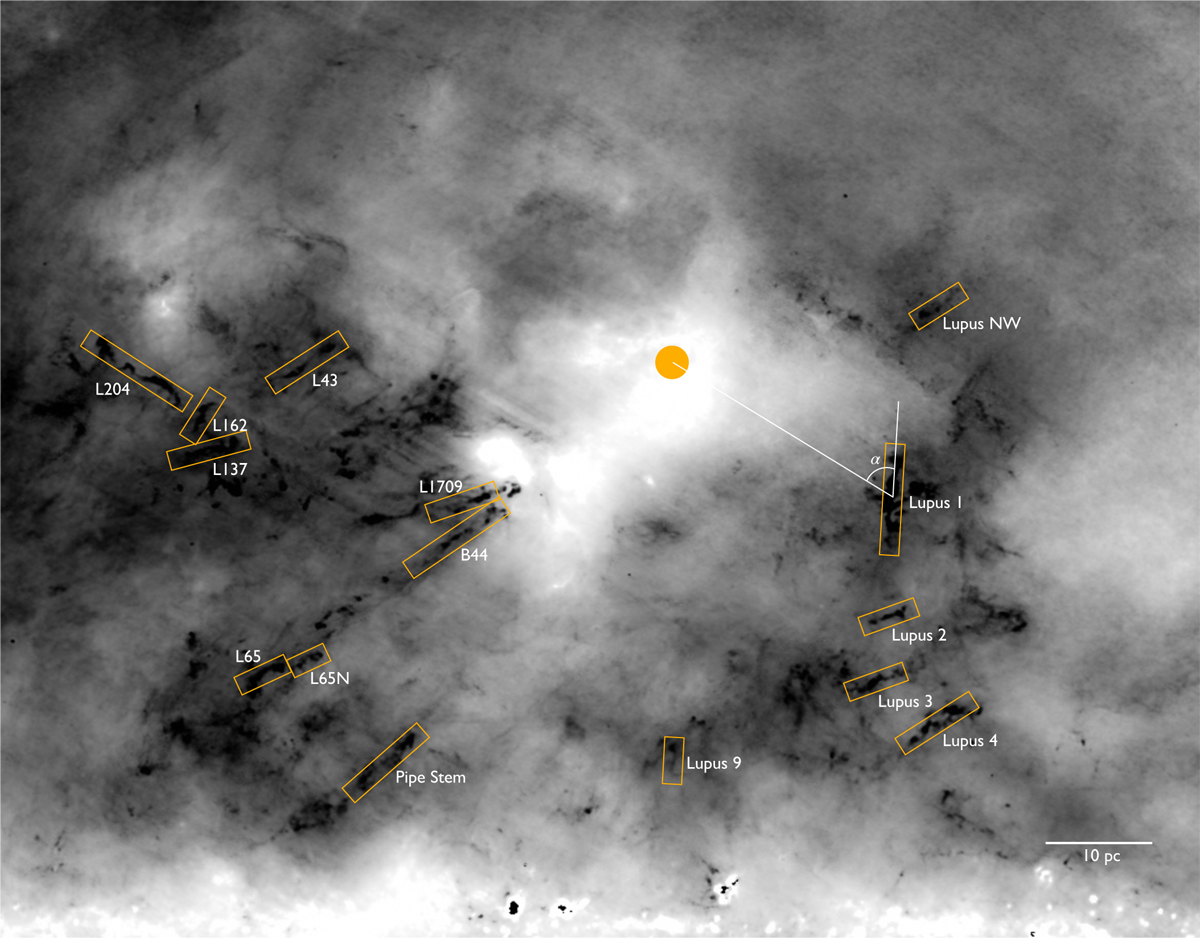
Orientations of the main filaments (enclosed in the orange boxes) in the Ophiuchus-Lupus-Pipe region, shown on the Meisner & Finkbeiner (2014) temperature map. The orientation angles were measured between the filament axis and the direction to a central point near the peak of the temperature map, marked with a closed orange circle in the map. This point is consistent with the location of the last supernova in Upper-Sco (about 2 Myr ago, Neuhäuser et al. 2020).
Current usage metrics show cumulative count of Article Views (full-text article views including HTML views, PDF and ePub downloads, according to the available data) and Abstracts Views on Vision4Press platform.
Data correspond to usage on the plateform after 2015. The current usage metrics is available 48-96 hours after online publication and is updated daily on week days.
Initial download of the metrics may take a while.