Fig. 11
Download original image
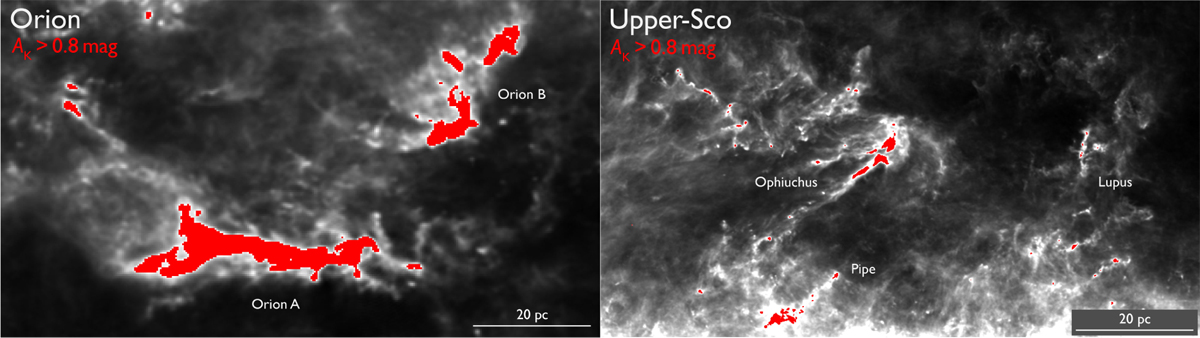
Comparing the Orion and Upper-Sco complexes at the same physical scale reveals striking differences in the amount and distribution of dense gas. The greyscale represents the Planck column density map (Meisner & Finkbeiner 2014), and red marks regions with dense gas (AK > 0.8 mag) likely to collapse into new stars. While the gas mass in Orion is about twice that of Upper-Sco, Orion contains ten times more dense gas. Critically, dense gas in Orion is concentrated in two main filamentary clouds, whereas Upper-Sco’s dense gas is more scattered across the region.
Current usage metrics show cumulative count of Article Views (full-text article views including HTML views, PDF and ePub downloads, according to the available data) and Abstracts Views on Vision4Press platform.
Data correspond to usage on the plateform after 2015. The current usage metrics is available 48-96 hours after online publication and is updated daily on week days.
Initial download of the metrics may take a while.