Fig. 5
Download original image
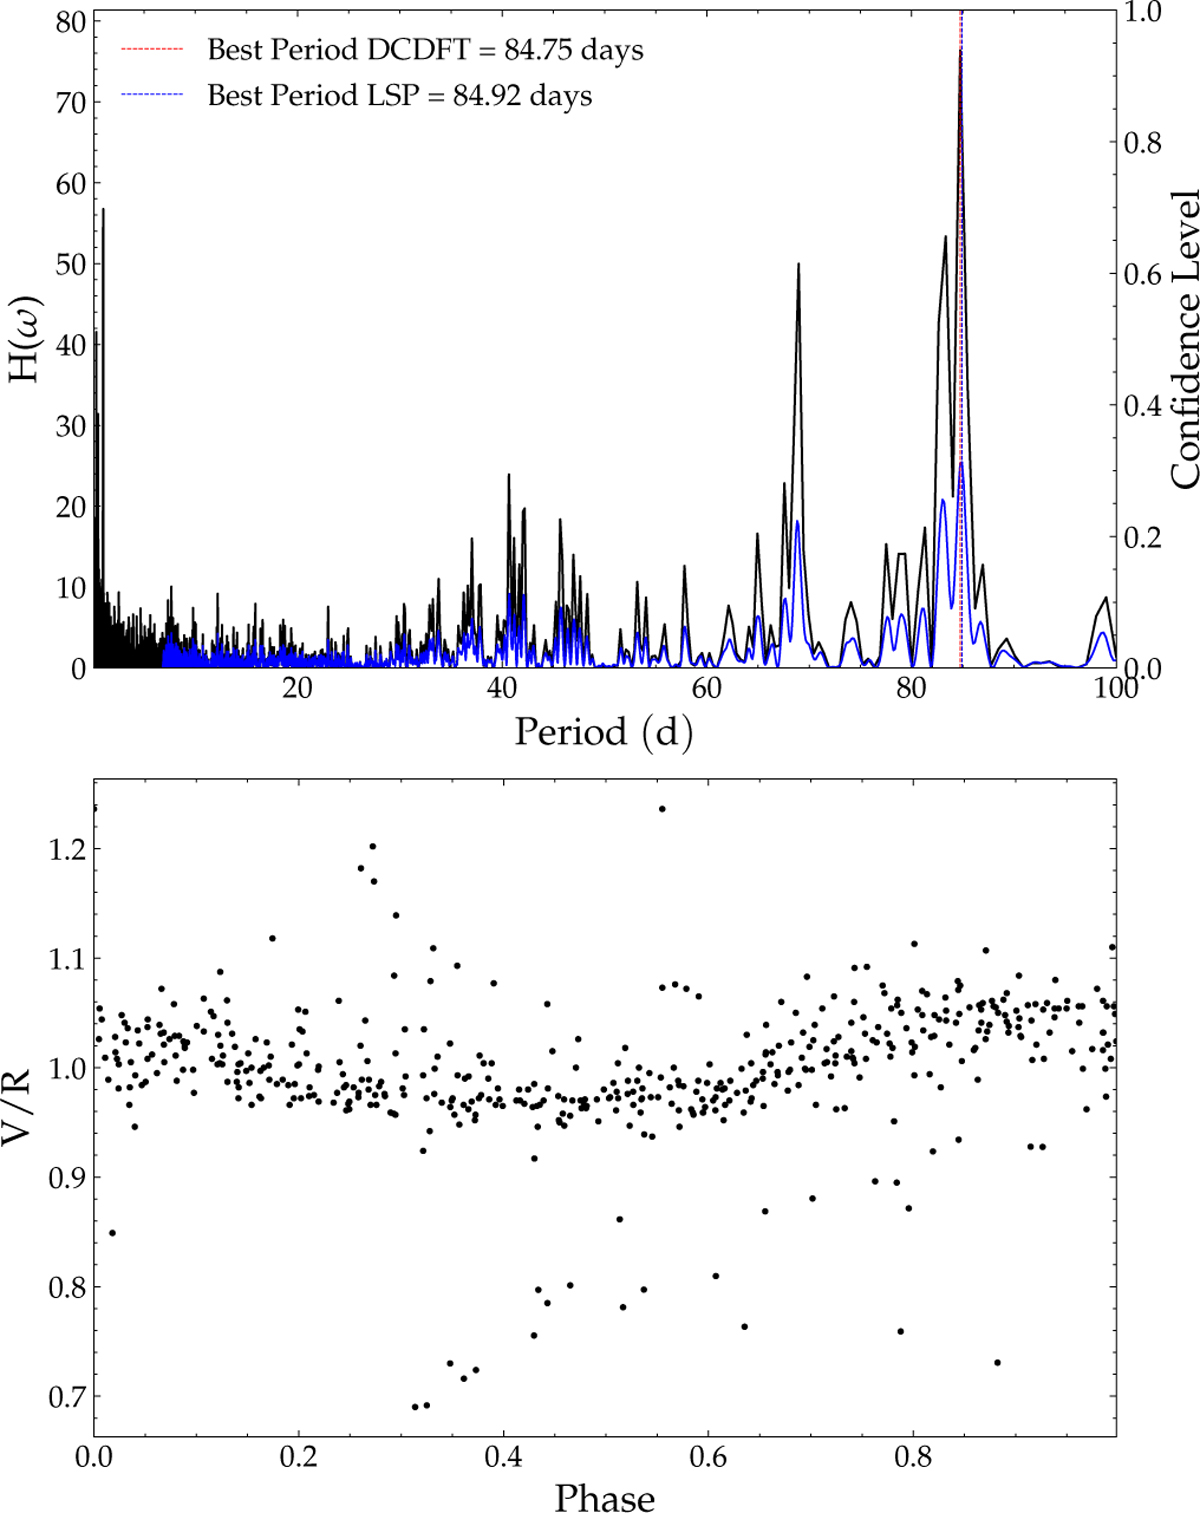
Top panel: power spectrum for the V/R presented in units of periods. The date-compensated discrete Fourier transform periodogram is shown as a black solid line, while the Lomb–Scargle periodogram is represented as a blue solid line. Both periodograms have been normalized by their respective means to enhance visibility. Bottom panel: phase of the V/R computed with the period of 84.75 days.
Current usage metrics show cumulative count of Article Views (full-text article views including HTML views, PDF and ePub downloads, according to the available data) and Abstracts Views on Vision4Press platform.
Data correspond to usage on the plateform after 2015. The current usage metrics is available 48-96 hours after online publication and is updated daily on week days.
Initial download of the metrics may take a while.