Fig. 2
Download original image
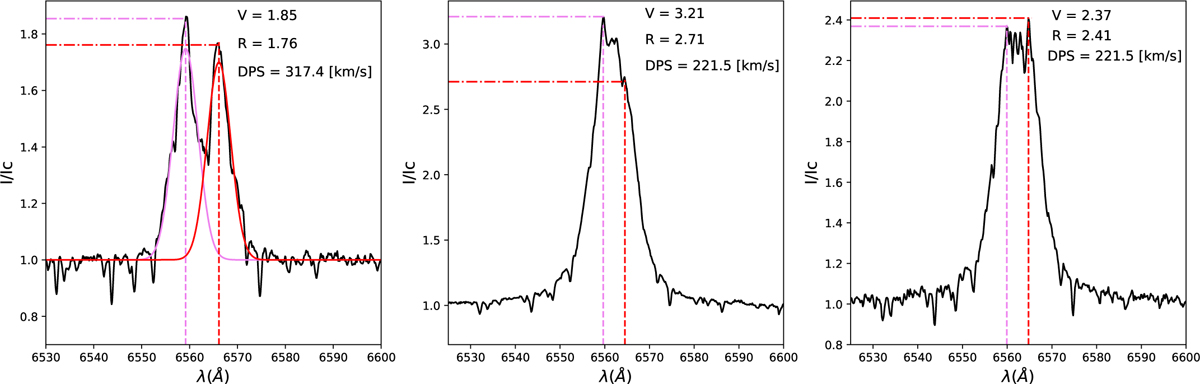
Method used to obtain V/R and DPS for different shape profiles (solid black line). Case 1 (left panel): distinguished DPS profile. The Gaussian fits are represented in pink and red for the violet and red peaks, respectively. The dashed lines indicate the Gaussian fit’s center and the values for both peak intensities. Values for this example are in the legend of the plot. Case 2 (middle panel): the code selects the maximum intensities from each side of the center (dashed vertical lines). Case 3 (right panel): flat emission line. For these cases, the peaks were selected by visual inspection from each side of the geometrical center of the line (dashed vertical lines).
Current usage metrics show cumulative count of Article Views (full-text article views including HTML views, PDF and ePub downloads, according to the available data) and Abstracts Views on Vision4Press platform.
Data correspond to usage on the plateform after 2015. The current usage metrics is available 48-96 hours after online publication and is updated daily on week days.
Initial download of the metrics may take a while.