Fig. B.6
Download original image
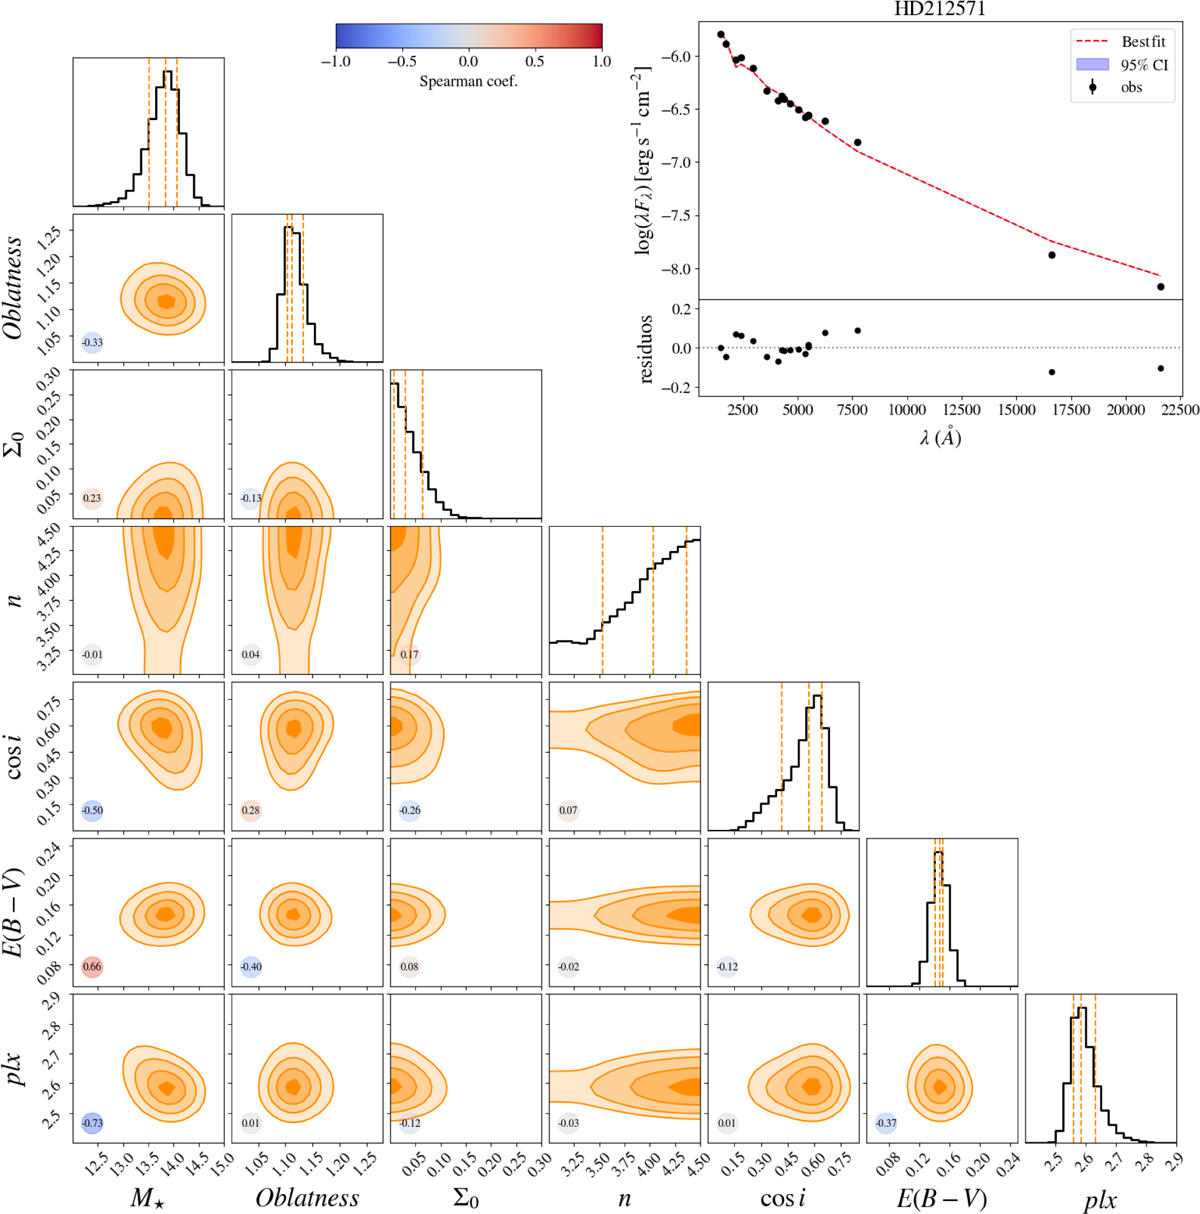
Corner plot of SED π Aquarii. The E(B − V) and parallax were also modeled. The 2D histograms for each pair of parameters are shown in dark orange. In the main diagonal, the PDFs for each parameter are displayed. The colored circles indicate the Spearman coefficient for the correlation between the pairs of parameters. In the upper-right inset, the observational data are in black dots, and residuals are plotted. The dashed red line corresponds to the model that maximizes the likelihood, and the blue region represents the reliability interval of 95% constructed from 100 random models sampled by the code.
Current usage metrics show cumulative count of Article Views (full-text article views including HTML views, PDF and ePub downloads, according to the available data) and Abstracts Views on Vision4Press platform.
Data correspond to usage on the plateform after 2015. The current usage metrics is available 48-96 hours after online publication and is updated daily on week days.
Initial download of the metrics may take a while.