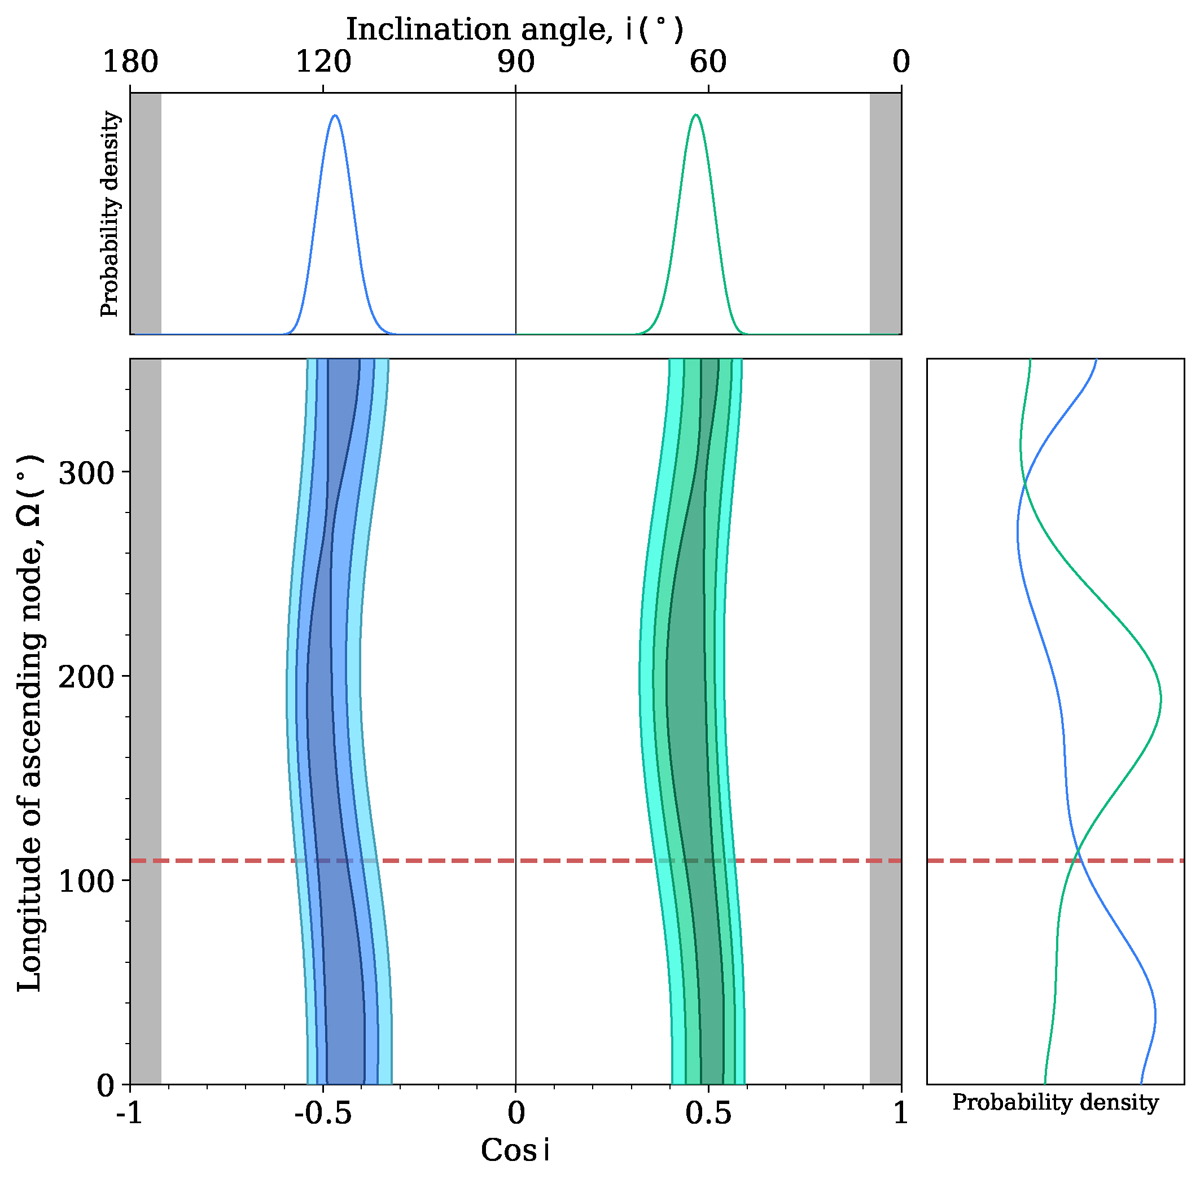
Fig. 9.
Download original image
Central panel: 2-D pdf for the full Ω − cos i space of binary pulsars. The blue and green contours show the probability density for inclination i > 90 deg and i < 90 deg, where increasing probability density is shown with darker shades. The grey regions are excluded based on the requirement that the pulsar mass must be greater than 0, and the dotted red line indicates the position angle of the proper motion of the system. Top panel: Probability density function for cosi, normalised to the maximum. Right-hand panel: Probability density function for Ω.
Current usage metrics show cumulative count of Article Views (full-text article views including HTML views, PDF and ePub downloads, according to the available data) and Abstracts Views on Vision4Press platform.
Data correspond to usage on the plateform after 2015. The current usage metrics is available 48-96 hours after online publication and is updated daily on week days.
Initial download of the metrics may take a while.