Fig. 3.
Download original image
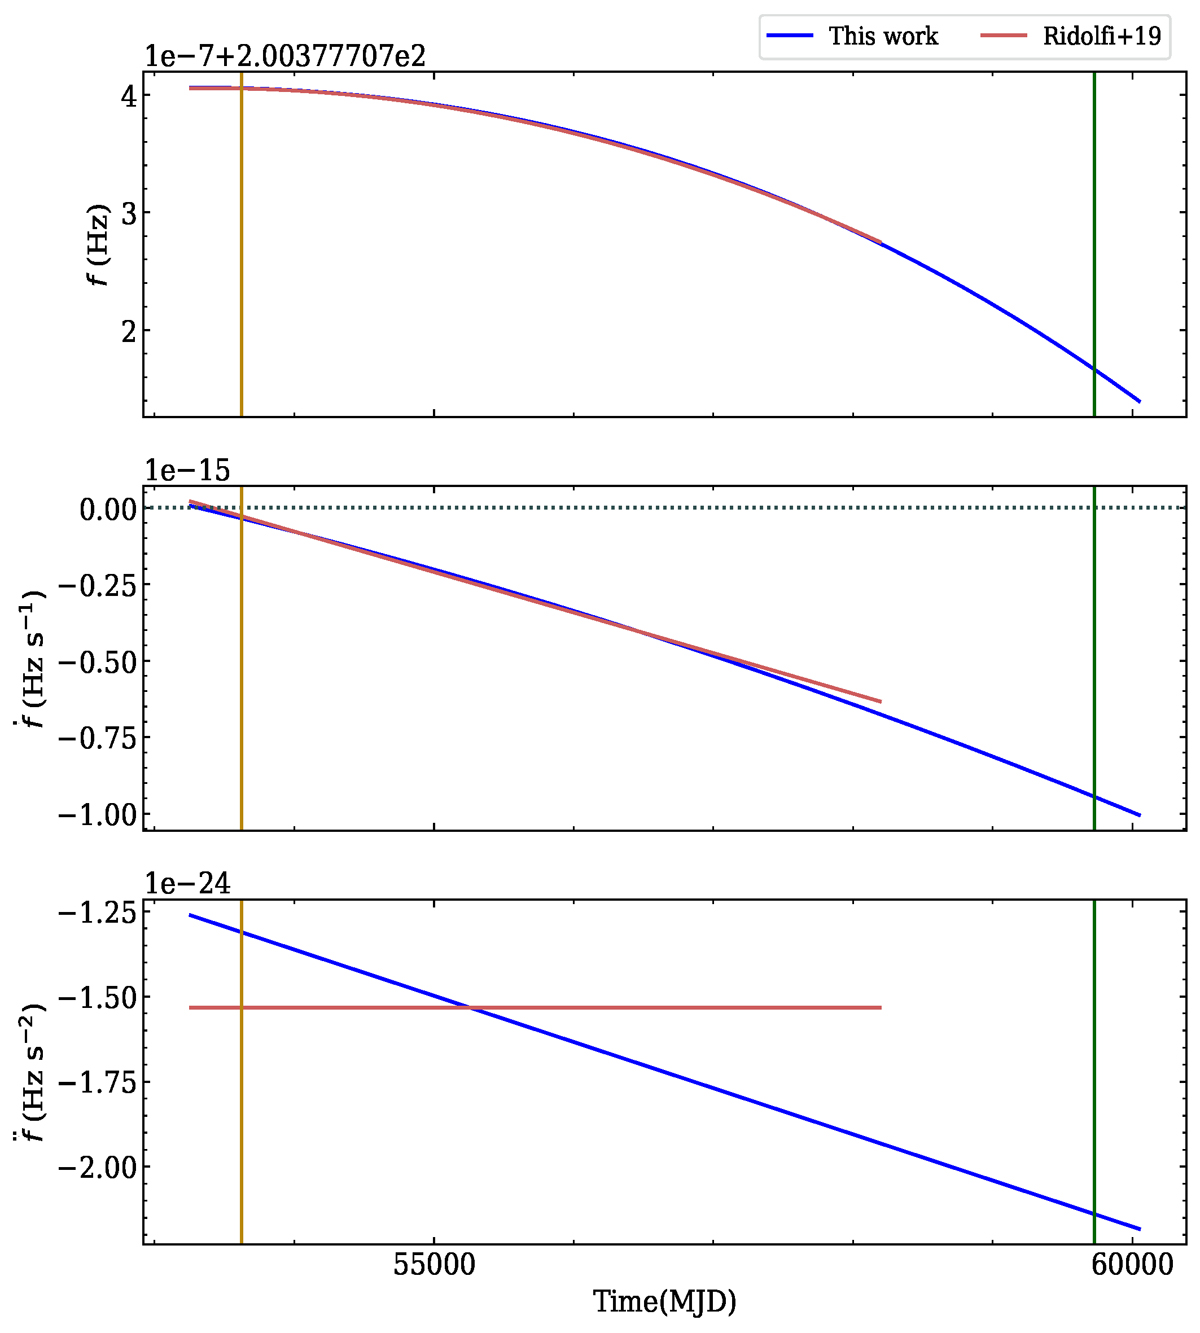
Top to bottom: Evolution of the observed spin frequency (f), its first derivative (ḟ), and its second derivative (![]() ) as a function of time (MJD). The vertical yellow and green lines indicate Epochs 1 and 2 respectively. The values from R19 are shown in red, and the results from this work are shown in blue. The large change in the ḟ value between the two epochs can be clearly seen.
) as a function of time (MJD). The vertical yellow and green lines indicate Epochs 1 and 2 respectively. The values from R19 are shown in red, and the results from this work are shown in blue. The large change in the ḟ value between the two epochs can be clearly seen.
Current usage metrics show cumulative count of Article Views (full-text article views including HTML views, PDF and ePub downloads, according to the available data) and Abstracts Views on Vision4Press platform.
Data correspond to usage on the plateform after 2015. The current usage metrics is available 48-96 hours after online publication and is updated daily on week days.
Initial download of the metrics may take a while.