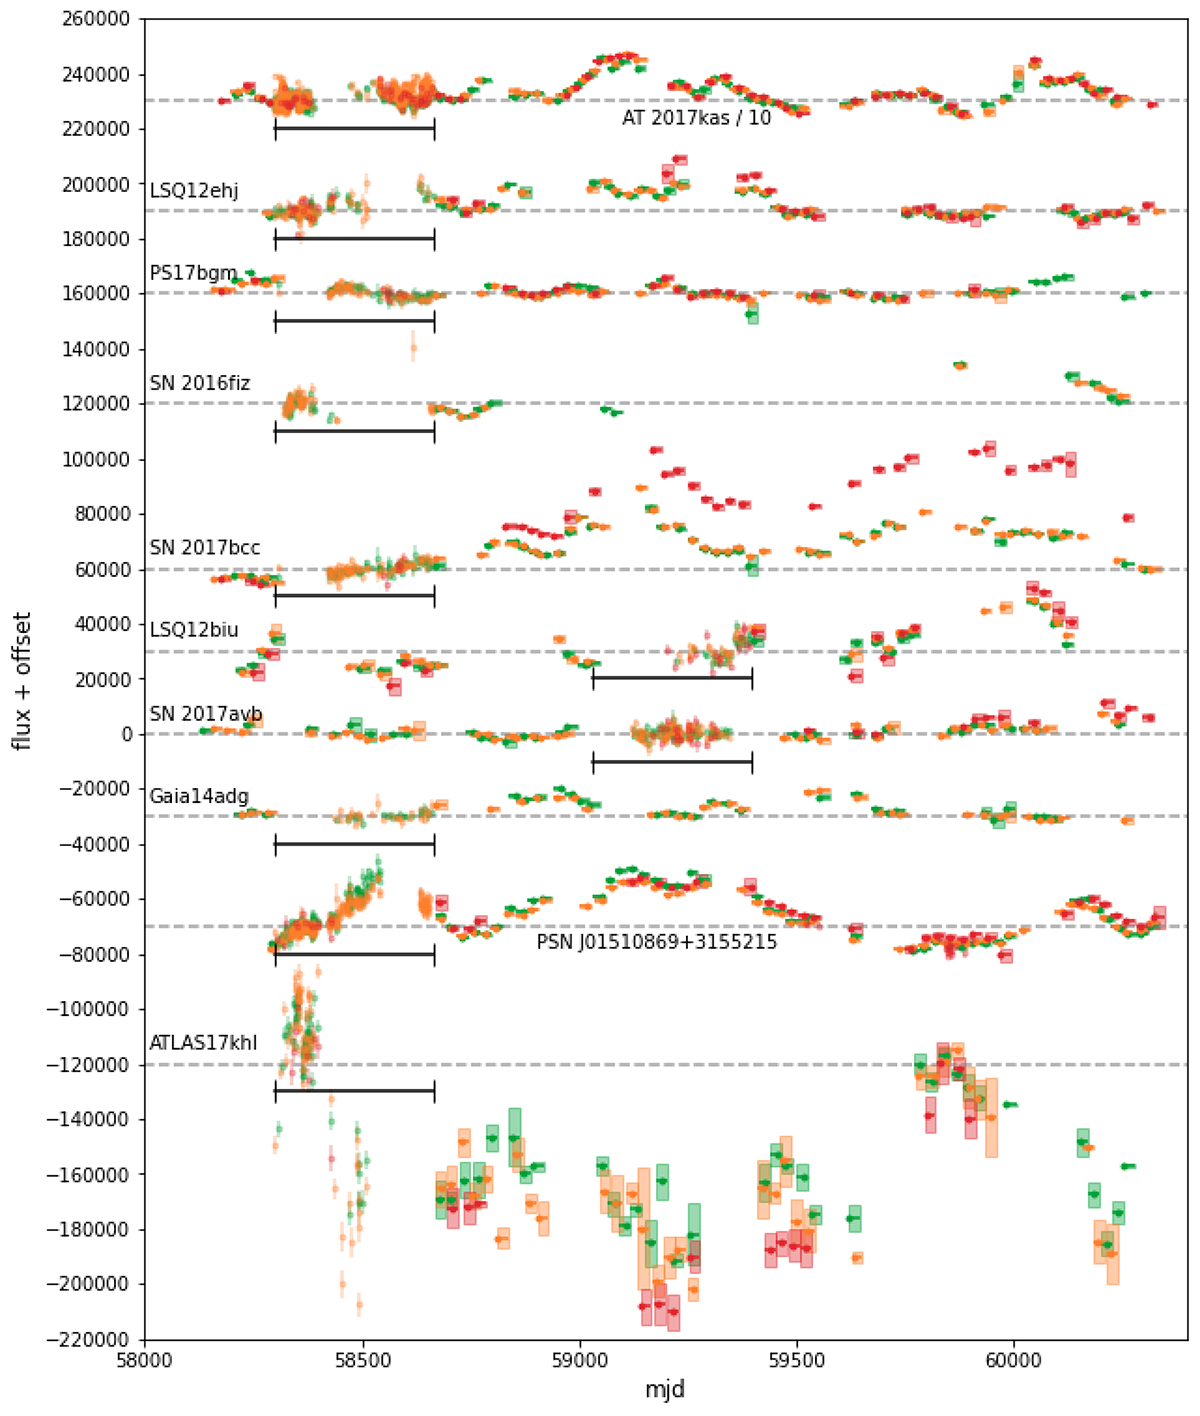
Fig. B.1.
Download original image
Binned flux of the recovered AGN. The flux is calibrated to a zeropoint at mag 30. The dashed lines show the baseline value for each object. Since the observations used to determine the baseline cannot be binned, we show the unbinned data in the baseline region of each object. This region is marked by the black lines. Even though not all objects are properly sampled over the entire lifetime of ZTF, they all clearly show variability over long timescales. As these objects are always varying, it is impossible to do a baseline correction without the transient present. This causes some light curves to go below their baseline. We note that the values for AT 2017kas have been divided by 10 as the variability is so large.
Current usage metrics show cumulative count of Article Views (full-text article views including HTML views, PDF and ePub downloads, according to the available data) and Abstracts Views on Vision4Press platform.
Data correspond to usage on the plateform after 2015. The current usage metrics is available 48-96 hours after online publication and is updated daily on week days.
Initial download of the metrics may take a while.