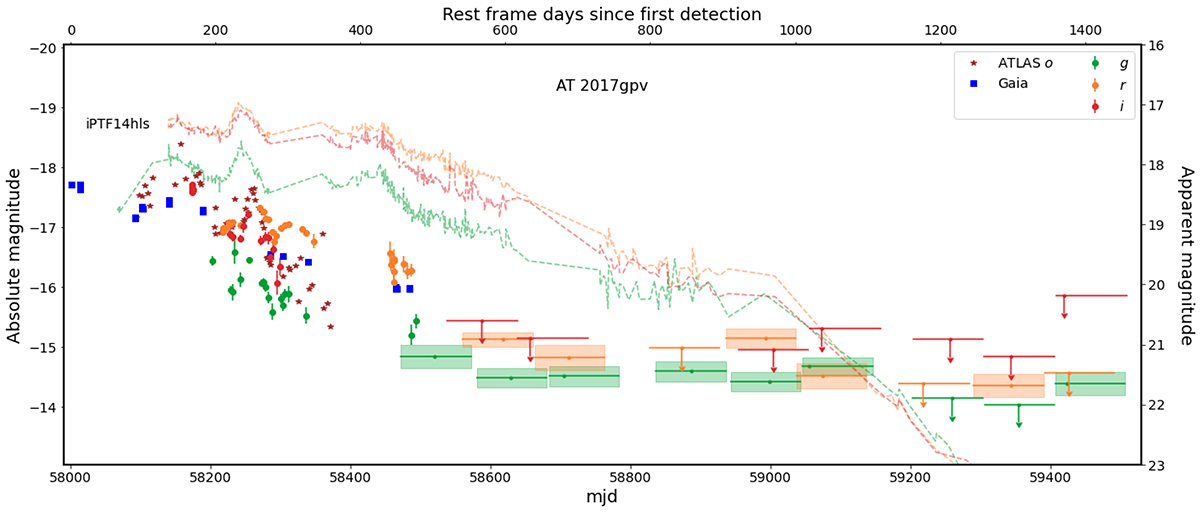
Fig. 4.
Download original image
Light curve of AT 2017gpv with the axes representing absolute magnitude (left), apparent magnitude (right), the rest frame days since first detection (top), and mjd (bottom). Single epoch detections by ZTF, Gaia, and ATLAS are shown, as well as the binned ZTF observations after the transient faded below the single epoch noise limit. The dashed lines are the gri-band light curves of iPTF2014hls, which have been corrected for time dilation but not extinction (data taken from Arcavi et al. 2017; Sollerman et al. 2019).
Current usage metrics show cumulative count of Article Views (full-text article views including HTML views, PDF and ePub downloads, according to the available data) and Abstracts Views on Vision4Press platform.
Data correspond to usage on the plateform after 2015. The current usage metrics is available 48-96 hours after online publication and is updated daily on week days.
Initial download of the metrics may take a while.