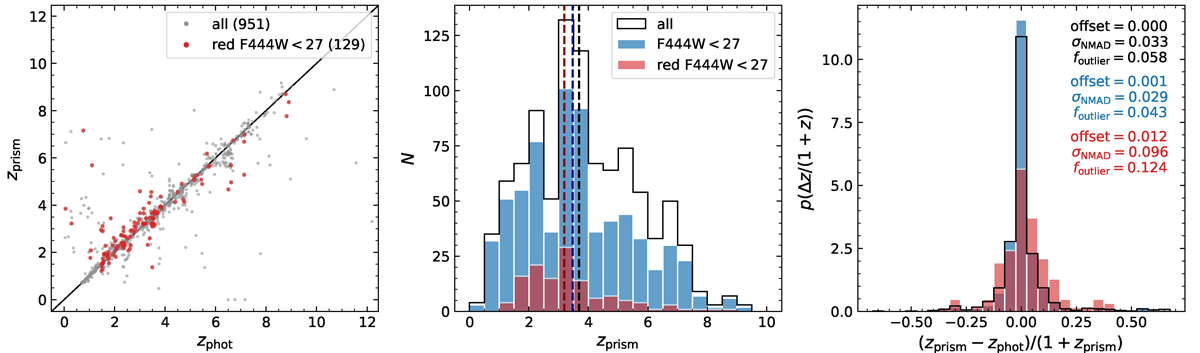
Fig. 7.
Download original image
Robust spectroscopic redshifts from the first half of RUBIES PRISM observations (obtained January–March 2024). Left: Comparison between the best-fit photometric redshifts used for target selection versus the best-fit spectroscopic redshift (zprism). Middle: Spectroscopic redshift distribution for all targets and the subset of red targets, defined as F150W−F444W>2. Dashed lines show the median redshifts. Right: Differences between the photometric and spectroscopic redshifts. Overall, there is good agreement between the photometric and spectroscopic redshifts. However, for red sources, the photometric redshift scatter is a factor of three higher than for the census sample, with an outlier fraction that is a factor of three higher than for similarly bright sources that are less red. This illustrates the need for spectroscopy, particularly for red sources.
Current usage metrics show cumulative count of Article Views (full-text article views including HTML views, PDF and ePub downloads, according to the available data) and Abstracts Views on Vision4Press platform.
Data correspond to usage on the plateform after 2015. The current usage metrics is available 48-96 hours after online publication and is updated daily on week days.
Initial download of the metrics may take a while.