Fig. 5.
Download original image
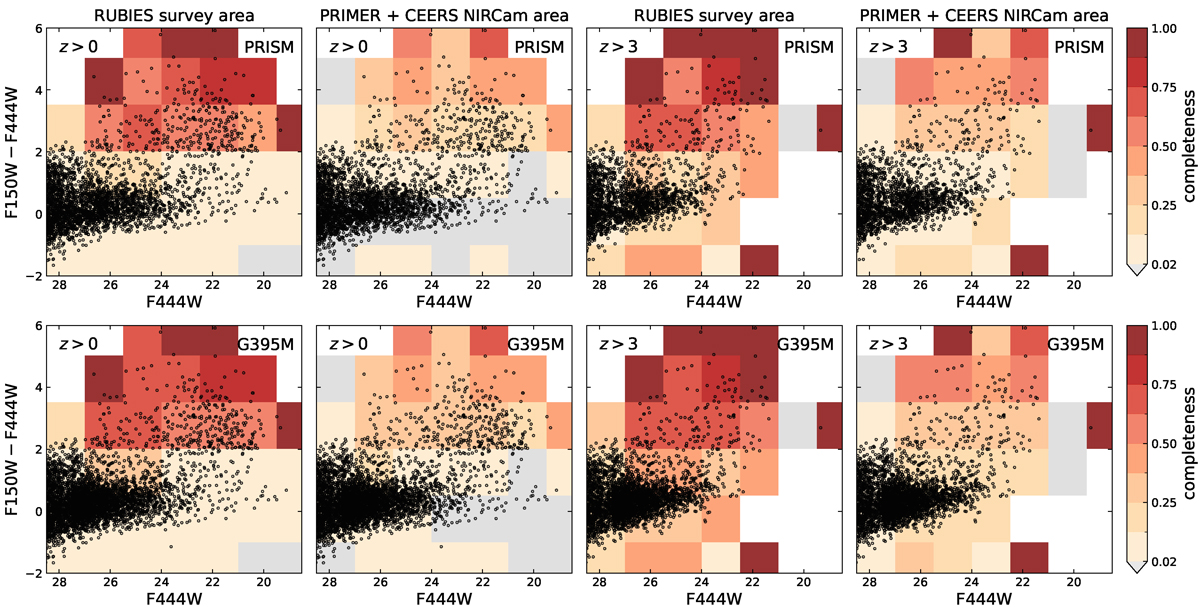
Distribution of F444W magnitudes and F150W−F444W colours of RUBIES targets for the PRISM (top) and G395M (bottom) observations. The symbols and colour scale are the same as in Fig. 4. The colour coding indicates the spectroscopic completeness computed for the RUBIES footprint alone or the full NIRCam area of the parent catalogue. The two sets of panels on the left show all sources, whereas those on the right only show sources with zphot>3. RUBIES reaches a very high completeness for red sources, especially at zphot>3. Comparison of the two different measures of completeness shows that RUBIES is biased towards red sources, which is the result of our pointing location optimisation (Sect. 2.5.1). Nevertheless, because the vast majority of sources in the parent sample are faint and blue (Fig. 3), the majority of RUBIES sources are also faint and blue, forming a critical comparison sample to place the rare red sources in the context of the broader galaxy population.
Current usage metrics show cumulative count of Article Views (full-text article views including HTML views, PDF and ePub downloads, according to the available data) and Abstracts Views on Vision4Press platform.
Data correspond to usage on the plateform after 2015. The current usage metrics is available 48-96 hours after online publication and is updated daily on week days.
Initial download of the metrics may take a while.