Fig. 4.
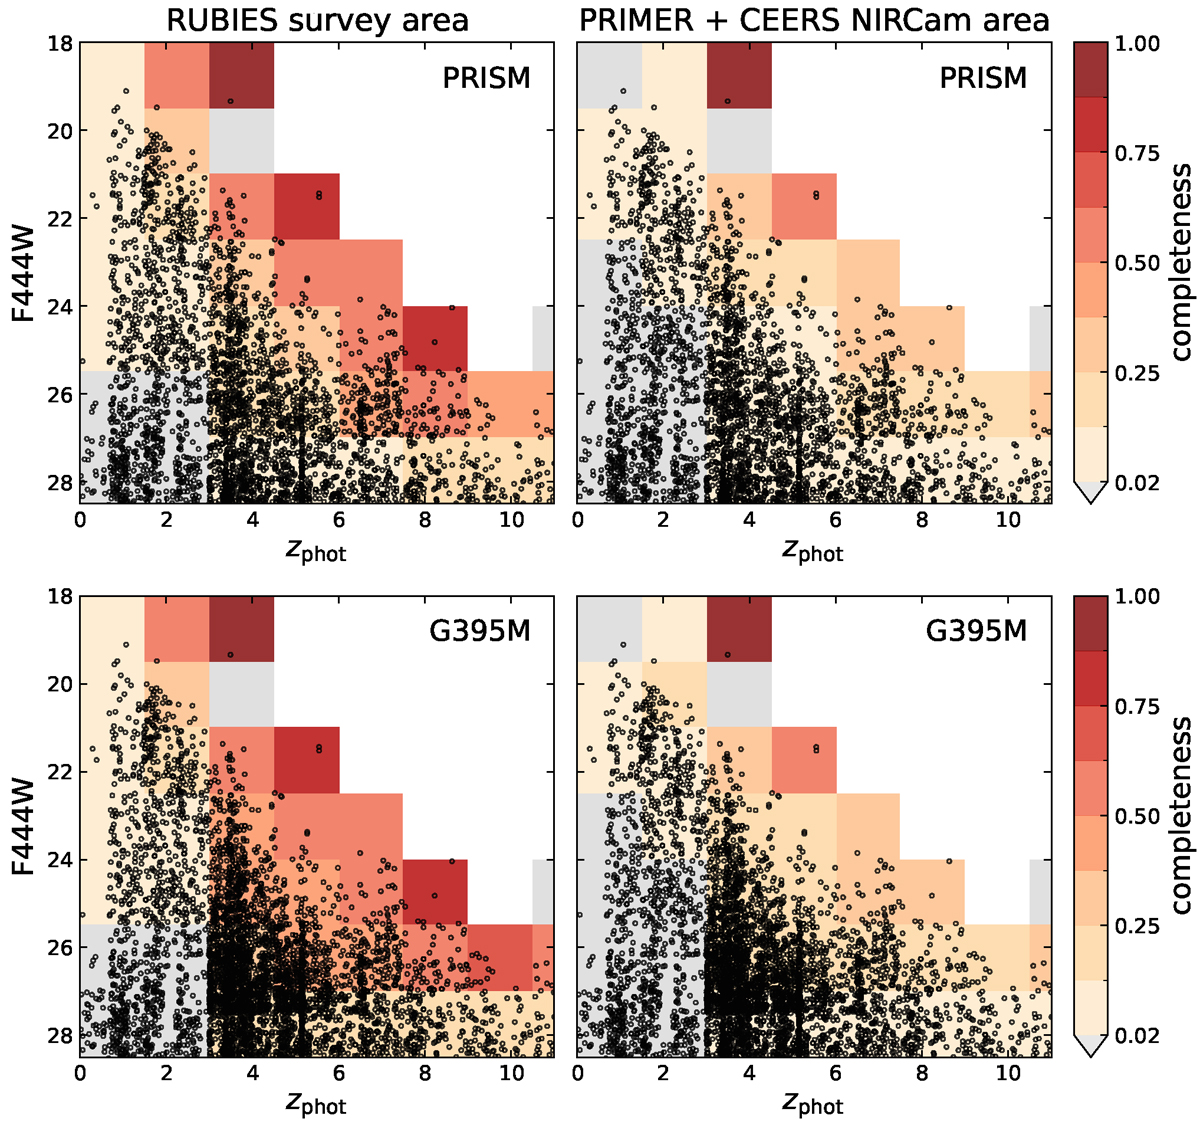
Download original image
Distribution of photometric redshifts and F444W magnitudes of RUBIES targets for the PRISM (top) and G395M (bottom) observations. Colour coding shows the spectroscopic completeness in each bin. On the left, the completeness is computed as the fraction of targets in the RUBIES NIRSpec footprint that are observed. On the right, this is calculated as the fraction of observed targets from the full parent catalogue (i.e. the total PRIMER and CEERS area, approximately double the area covered by RUBIES). The RUBIES selection function achieves high (>50%) spectroscopic targeting completeness for bright high-redshift sources, even reaching >70% in the extremes of the parameter space.
Current usage metrics show cumulative count of Article Views (full-text article views including HTML views, PDF and ePub downloads, according to the available data) and Abstracts Views on Vision4Press platform.
Data correspond to usage on the plateform after 2015. The current usage metrics is available 48-96 hours after online publication and is updated daily on week days.
Initial download of the metrics may take a while.