Fig. A.1.
Download original image
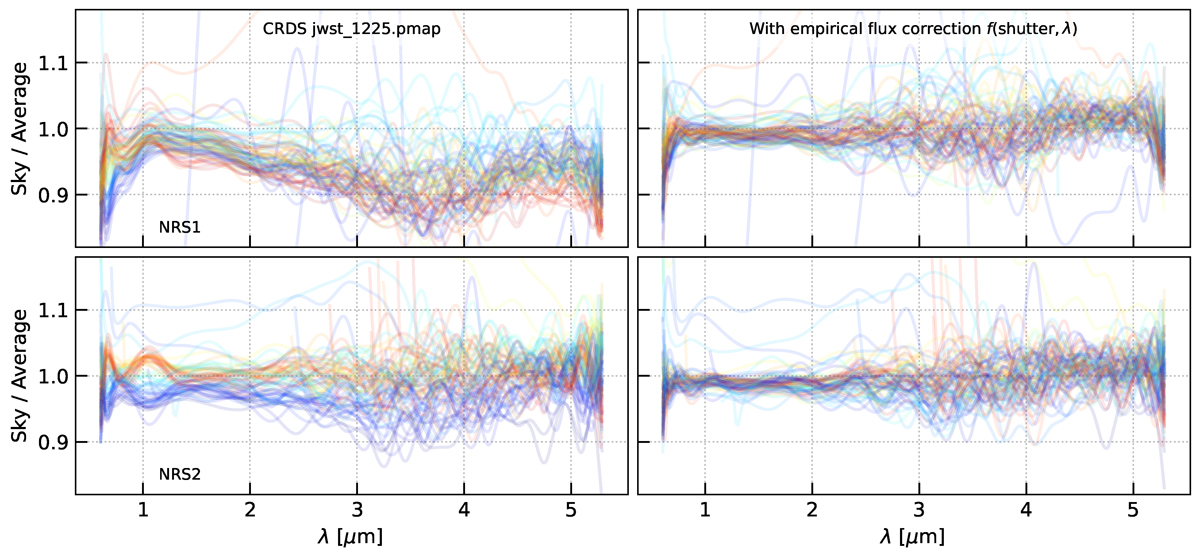
Position and detector normalisation derived from sky spectra. The lines in the left panels show the ratio of the background spectra measured from individual slitlets relative to the average spectrum of all slitlets, with the line colours indicating the “y” position of a slitlet within the field of view. Clearly, there are wavelength- and y-dependent systematics. The right panels show the ratios after applying the position- and wavelength-dependent flux scale correction.
Current usage metrics show cumulative count of Article Views (full-text article views including HTML views, PDF and ePub downloads, according to the available data) and Abstracts Views on Vision4Press platform.
Data correspond to usage on the plateform after 2015. The current usage metrics is available 48-96 hours after online publication and is updated daily on week days.
Initial download of the metrics may take a while.