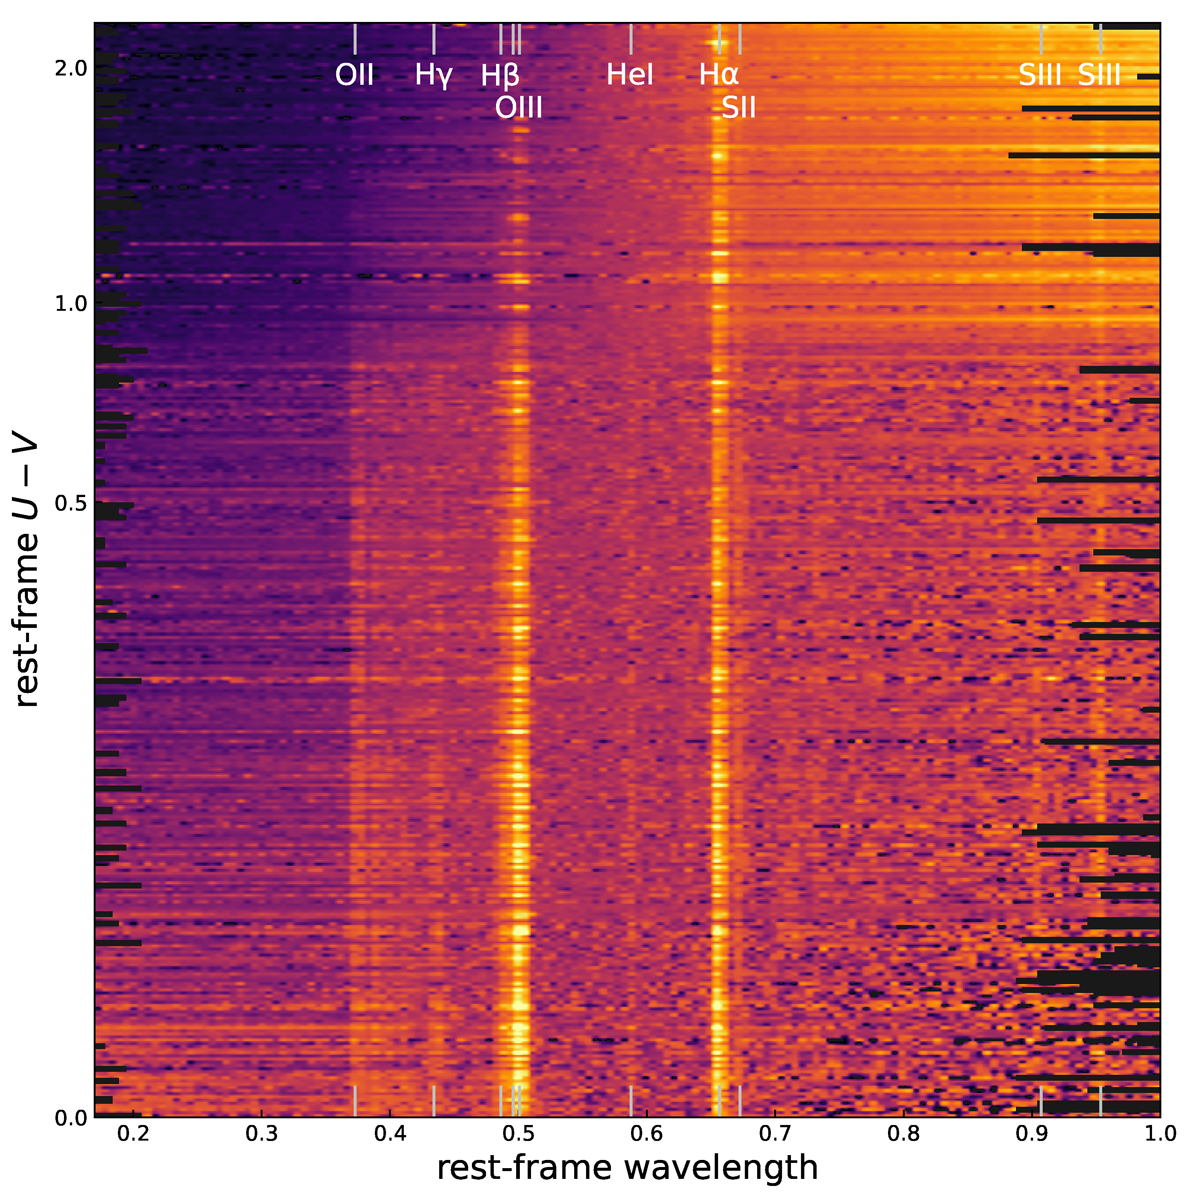
Fig. 12.
Download original image
RUBIES spectra at 2<zprism<5 and with median continuum S/N>1, sorted by rest-frame U−V colour (spectra normalised by the median flux between rest-frame 0.51−0.64 μm). The bluest sources show the strongest emission lines, while the Balmer break becomes more prominent for redder sources. For the very reddest sources (near the top) there is a diversity in spectral shapes and visible emission lines, with a mixture of dusty galaxies, quiescent galaxies and red AGNs.
Current usage metrics show cumulative count of Article Views (full-text article views including HTML views, PDF and ePub downloads, according to the available data) and Abstracts Views on Vision4Press platform.
Data correspond to usage on the plateform after 2015. The current usage metrics is available 48-96 hours after online publication and is updated daily on week days.
Initial download of the metrics may take a while.